Unit 1
Exploring Data
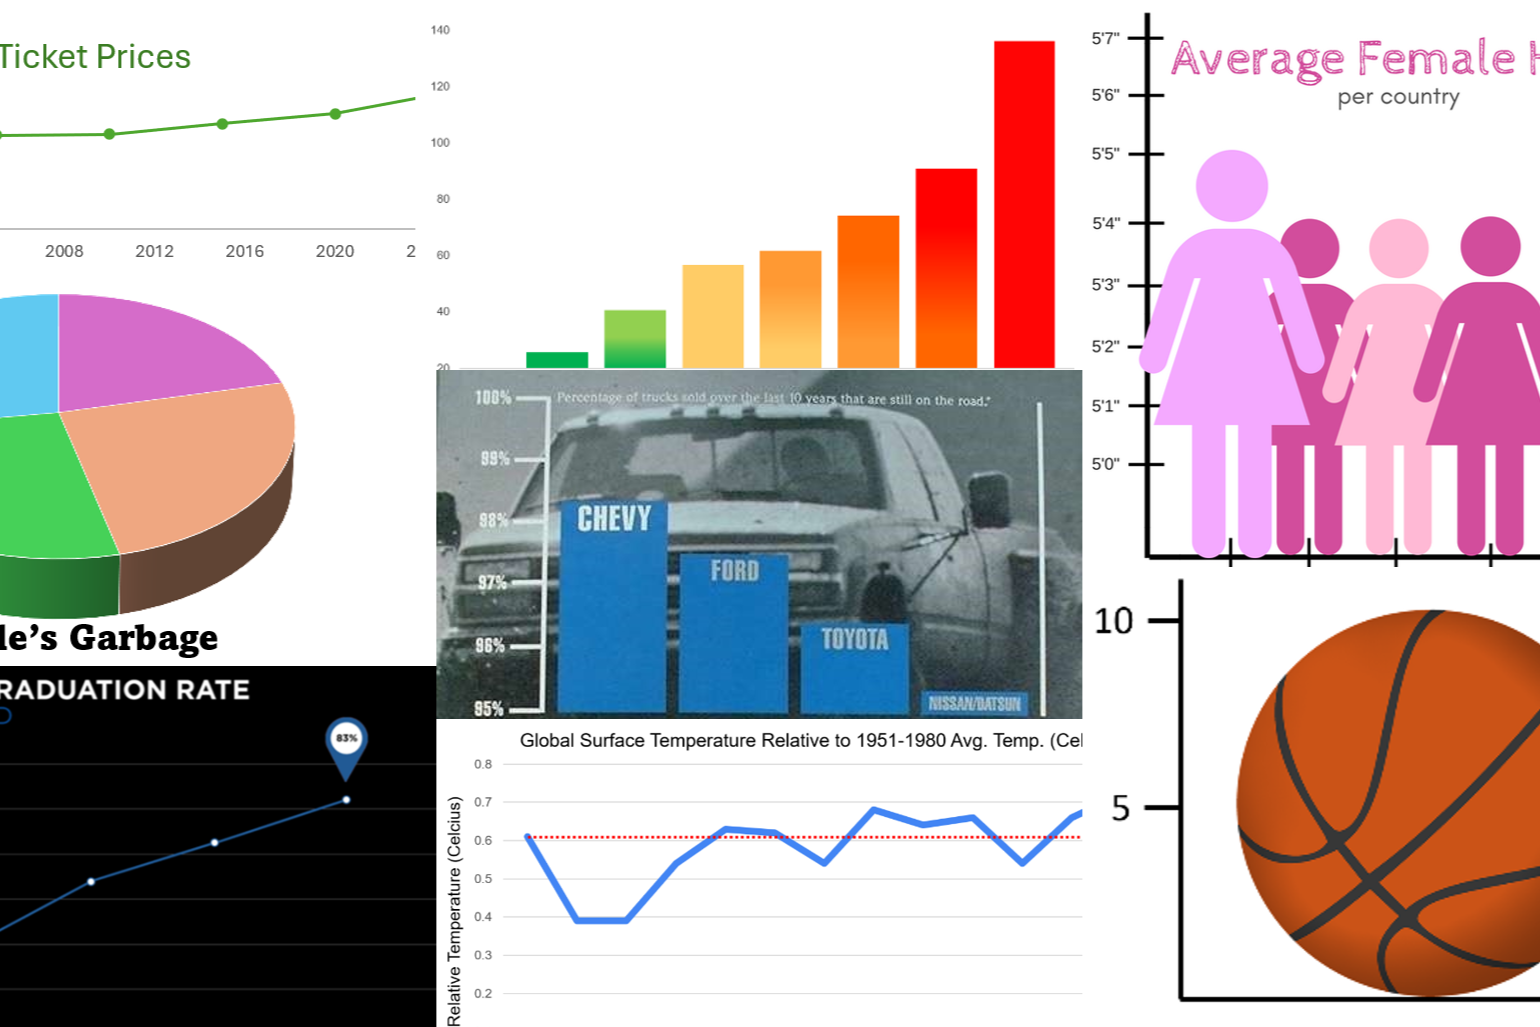
1.1 - Misleading with Data
Key Question: How can we tell if a data visual is misleading?
Content: Observations & Variables | Classifying Variables | Misleading Graphs

1.2 - Describing a Categorical Variable
Key Question: Why are more elite athletes born in January - June?
Content: Frequency & Relative Frequency | Bar & Pie Charts | Making Comparisons

1.3 - Describing a Quantitative Variable
Key Question: Why would anyone make (or watch) a movie about the Oakland A's?
Content: Dotplots | Histograms | Describing Distributions

1.4 - Measures of Center & Visualizing Data
Key Question: How can we preserve the American Dream?
Content: Measures of Center | Tools for Visualizing Data

1.5 - Measures of Spread & Percentiles
Key Question: Is the American Dream still alive?
Content: Measures of Center | Percentiles | Visualizing Data

1.6 - Boxplots & Resistance
Key Question: How much money will you really make?
Content: Outliers | Boxplots | Resistance

1.7 - Comparing Graphs & Z-Scores
Key Question: Who is the greatest scorer in NBA history?
Content: Comparing Graphs | Z-Scores
Unit 1 Assessment Bank
Select, mix, and modify questions from the assessment bank to fit your instructional needs.