
Lesson 5.1 - Introduction to Confidence Intervals
Key Question: How do polls account for error?
Content: Point Estimates & Margins of Error | Interpreting Confidence Intervals & Levels
Teacher Guide
Course Resources
Resources for teaching our AP® Statistics curriculum.
- Lesson Flow - timing and flow of class, using our lesson materials
- Pacing Guide - pacing our units, with daily or block schedules
- CED Alignment Guide - aligning our lessons to the AP® Statistics Course and Exam Description
Teaching Resources
Resources for teaching with Skew The Script.
- Discussion Norms - our model discussion norms for the classroom
- Letter to Parents - letter to share with parents about our nonpartisan approach
- Teaching Math on Civic Topics - tips for teaching math lessons that cover civic topics
Lesson Notes
Lesson-specific insights from the creators of this lesson.
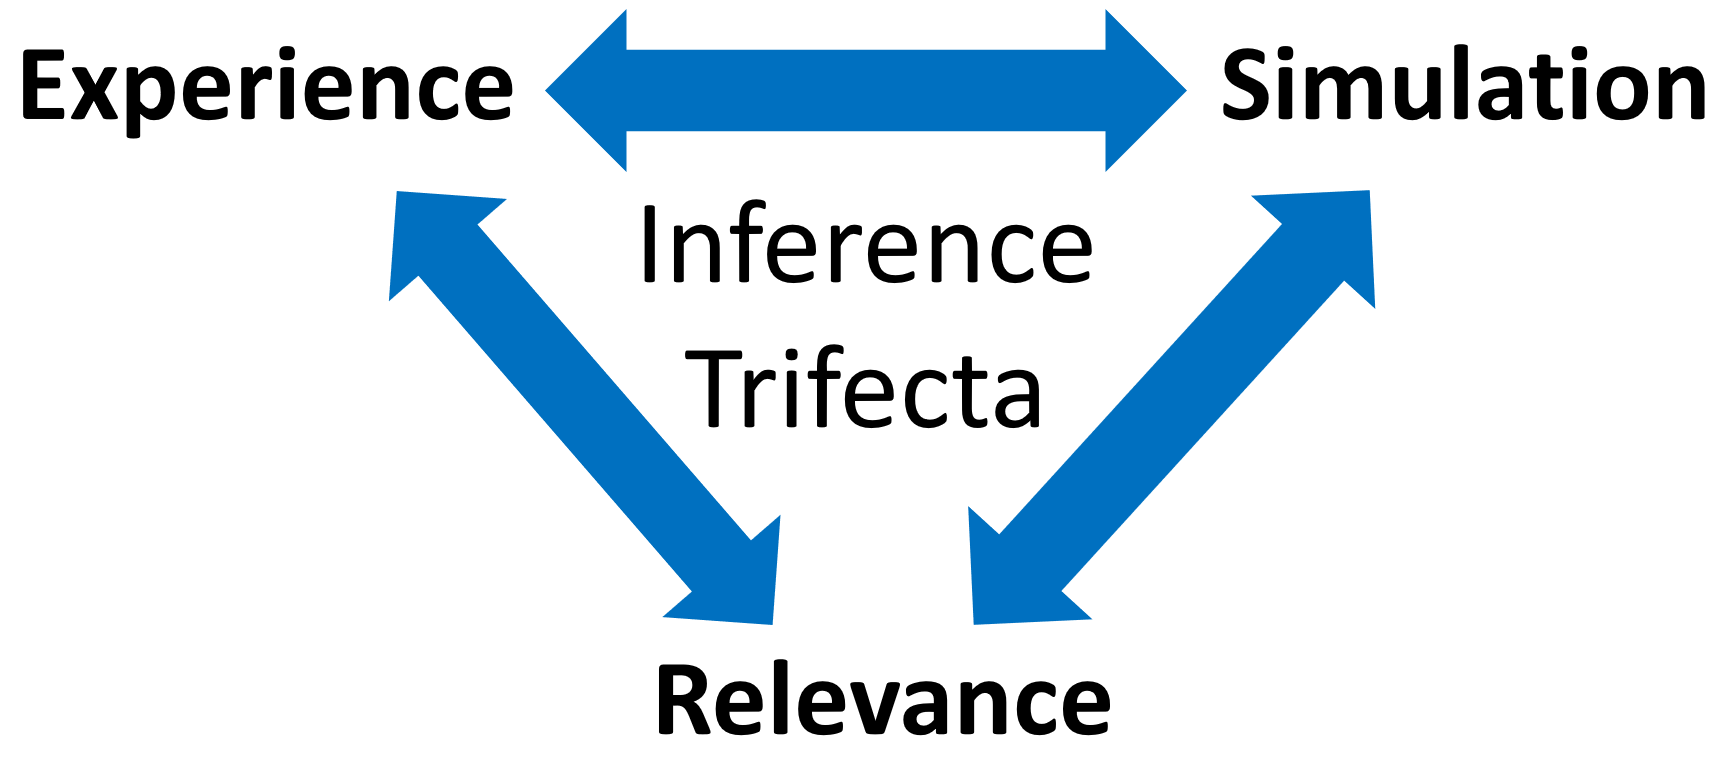
Note that this lesson uses the inference trifecta approach, which differs from our typical lesson format. Before proceeding, watch the Teacher Guide Video above and familiarize yourself with the lesson materials (e.g. handout and key). Then, for additional background and suggestions from the lesson creators, check out the sections below.
- Calculate a confidence interval, given a point estimate and margin of error
- Interpret a confidence interval and a confidence level
- Determine how changes in confidence level and sample size affect the width of confidence intervals
Now that students have tackled hypothesis testing (Unit 4), they turn to a different group of inference methods: confidence intervals. In this first lesson of the unit, students act as pollsters. Specifically, using a random sample of likely voters, they estimate the proportion of all voters that will cast their ballots for a candidate on election day. Then, they leverage their prior understanding of simulations and sampling distributions (from the last unit) to build margins of error for their estimates – thereby constructing their first confidence intervals. The precise calculations related to critical values and conditions checks are saved for later lessons in the unit, so as to allow students to focus on building an intuitive understanding of confidence intervals and their interpretations.
- For daily class schedules (45-min class periods), this lesson can be completed in two days:
- Day 1: Lesson Starter, Activity, & Discussion Question
- Day 2: Lesson Synthesis, Practice, & Mastery Check
- For block periods (90-minute class periods), the entire lesson can be completed in 1 class day.
- Students complete the Amplify activity (with instructors facilitating), as they record notes in their handout along the way. To facilitate an Amplify activity, instructors can create an Amplify account (also free) and share a single session code with their students (who can join without accounts).
- For facilitating the Amplify activity, we recommend using the “Sync to Me” pacing option. For more Amplify activity facilitation tips, check out our Amplify/Desmos session with expert Kevin McSorley.
- In the activity screen that allows students to generate many confidence intervals, the confidence level is adjustable after intervals are generated. However, the sample size is only adjustable before intervals are generated. So, students will have to click “try again” and create new simulations in order to adjust the sample size.
- After the notes, students discuss the Discussion Question in their tables groups. Then, students discuss in full-group, with the instructor facilitating.
First, download this lesson's slide deck and handout key to see the prompt and sample responses for the Lesson Starter. Then, check out the additional background notes below.
Instructional routine: Notice & Wonder. The lesson handout provides a Notice & Wonder T-frame for students to capture their notes and ideas. It is important that students recognize the difference between a noticing (observation) and a wondering (question that comes to mind). You can find more background on implementing a Notice & Wonder here.
Purpose & Background: This lesson starter invites students to notice and wonder about polling data, without providing the specific location, political office, or election year tied to the polls. This allows students to complete a first examination of polling data without leveraging any strong prior beliefs related to a specific politician or election. Instead, students have the opportunity to see that polls can vary, even for the same candidates and around similar dates. Note that students have previously completed a Notice & Wonder about polling data in Lesson 4.5. However, the polling data in this lesson differs in two key ways: the margins of error (“MoE”) are provided, and the polls show both candidates leading at different times. This allows students to explore two key ideas for this lesson: margins of error and sampling variability. These polls are from the 2022 Senate election in Georgia (compiled by Real Clear Polling). This context can be revealed to students after the Notice & Wonder routine, but the details of this particular race are less important than recognizing the broader pattern of different polls producing different estimates prior to an election.
First, download this lesson's Handout Key and read through its Discussion Question section. Then, check out our model discussion norms and the additional background notes below.
- Another potential source of bias in the newspaper poll could be nonresponse bias, since the subscribers who choose to respond to the poll could be different from the subscribers who choose not to respond.
- For a more thorough review of types of sampling bias, see Lesson 2.3.
- This lesson introduces confidence intervals conceptually, but does not yet delve into the formal procedures for constructing exact intervals. That happens in the next lesson. Still, it is helpful to reinforce the connection between confidence intervals and the shape, center, and spread of the sampling distribution of p̂. Sketches of normal curves can help students visualize how confidence intervals are built around a sample statistic.
- The interpretation of confidence levels in this lesson (“If we take many samples of the same size from this population, about ___% of them will result in an interval that captures the actual parameter value”) is from the frequentist perspective of statistics. In the Bayesian perspective, the confidence level represents the degree of belief that the parameter lies within the interval. Traditionally, the frequentist interpretation has been the preeminent view in the field, and it’s the view taken by most state standards for statistics. However, the Bayesian view has gained some popularity in recent years, especially as computers have made Bayesian calculations easier to perform. A lot can be said about the difference between these schools of thought. Our favorite commentary is this cartoon by xkcd.
- Confidence intervals are usually written as two values (lower bound, upper bound). However, they can also be written in the form “statistic ± margin of error,” which represents the same interval structure. Recognizing both forms is useful, as students are likely to see both in publications outside of this course.
Student Supports
Lesson-specific resources to support all learners.
- Reinforce that the center of a confidence interval is the sample statistic, while the width of the interval is determined by the margin of error. This distinction becomes increasingly important as students begin formally constructing and comparing intervals later in the unit.
- To clarify why larger sample sizes produce narrower confidence intervals, consider connecting this idea back to sampling distributions by emphasizing that larger samples produce less variability in p̂ from sample to sample, which leads to more precise estimates of the population parameter.
-
Vocabulary used in the context of the lesson may include words that are unfamiliar or have several meanings. In particular, the following mathematical terms may need clarification or a definition provided:
- Point estimate
- Margin of error
- Lower bound
- Upper bound
- Confidence level
- Confidence interval
-
In addition, the following contextual terms may need clarification or a definition provided:
- Election
- Polls
- To support students in distinguishing the term “confidence interval” from “confidence level,” encourage them to separately identify the interval endpoints, the center, the margin of error, and the confidence level before interpreting the interval in context.