
Lesson 5.2 - Interval for a Proportion

Key Question: How did Flint use data to hold its officials accountable?
Content: One-Sample z-Interval for a Population Proportion
Teacher Guide
Course Resources
Resources for teaching our AP® Statistics curriculum.
- Lesson Flow - timing and flow of class, using our lesson materials
- Pacing Guide - pacing our units, with daily or block schedules
- CED Alignment Guide - aligning our lessons to the AP® Statistics Course and Exam Description
Teaching Resources
Resources for teaching with Skew The Script.
- Discussion Norms - our model discussion norms for the classroom
- Letter to Parents - letter to share with parents about our nonpartisan approach
- Teaching Math on Civic Topics - tips for teaching math lessons that cover civic topics
Lesson Notes
Lesson-specific insights from the creators of this lesson.
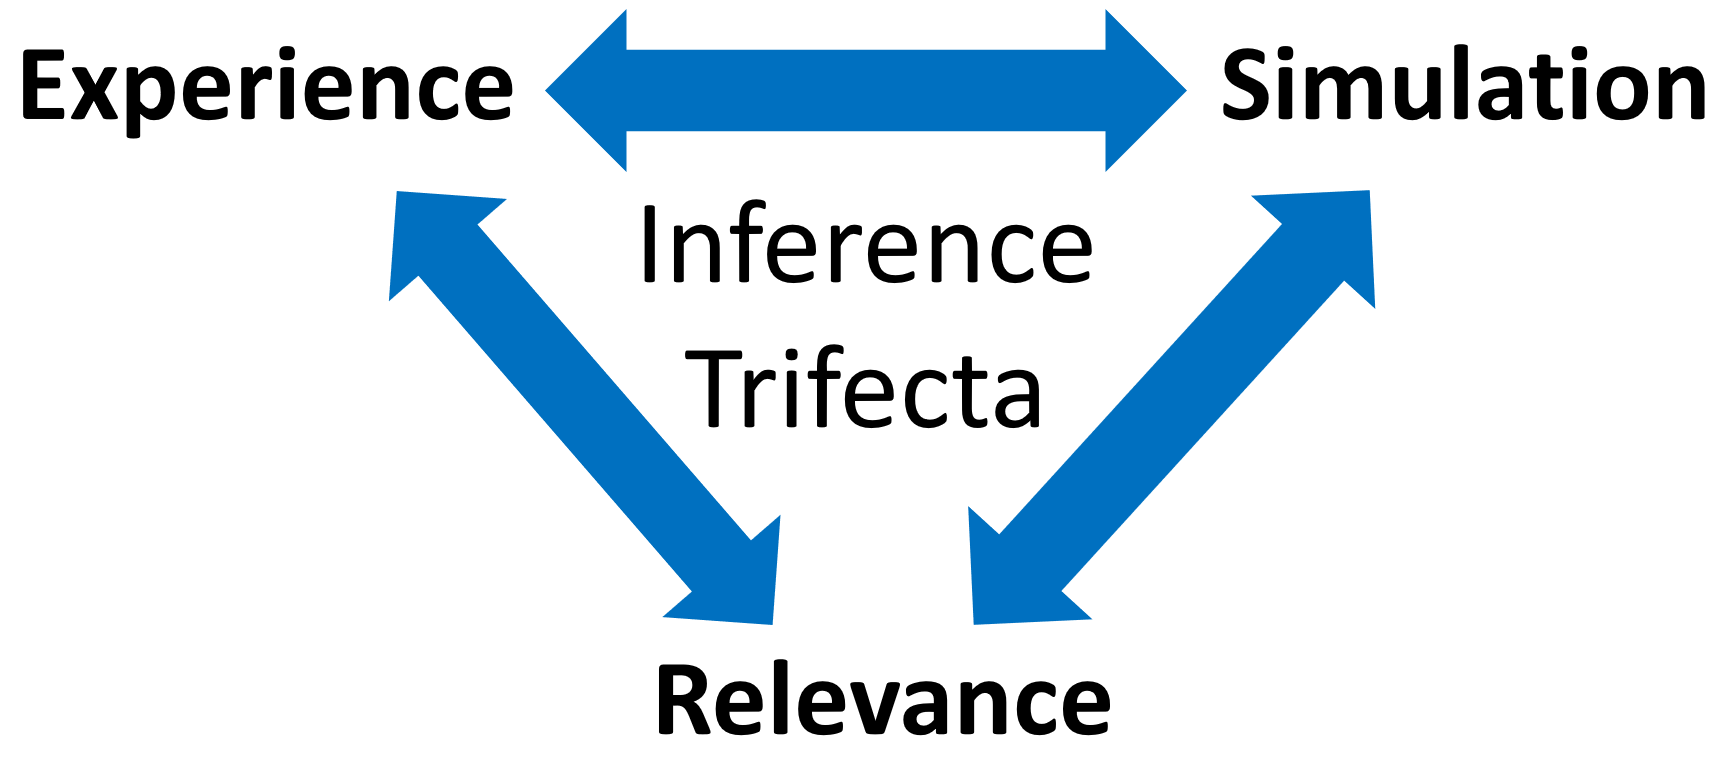
Note that this lesson uses the inference trifecta approach, which differs from our typical lesson format. Before proceeding, watch the Teacher Guide Video above and familiarize yourself with the lesson materials (e.g. handout and key). Then, for additional background and suggestions from the lesson creators, check out the sections below.
- Check conditions for a one-sample z-interval for a population proportion
- Calculate and interpret a one-sample z-interval for a population proportion (at the 95% confidence level)
- Use a confidence interval to justify a claim about a population proportion
Now that students have explored the interpretation of a confidence interval and a confidence level (in Lesson 5.1), they formalize their learning in this lesson by constructing their first one-sample z-interval for a population proportion. In this lesson, they are only tasked with constructing their intervals at the 95% confidence level. In the next lesson (5.3), they will learn how to create more flexible intervals by varying the level of confidence or by varying the sample size.
- For daily class schedules (45-min class periods), this lesson can be completed in two days:
- Day 1: Lesson Starter, Activity, & Discussion Question
- Day 2: Lesson Synthesis, Practice, & Mastery Check
- For block periods (90-minute class periods), the entire lesson can be completed on the same day.
- Ideally, every student will have their own device (e.g. laptop) to engage in the online components of the activity. However, the activity can also be completed successfully in pairs or without student devices. Guidance on modifying the activity without student devices is given below.
- To begin, students engage in the Lesson Starter (prompt provided in the lesson slide deck, students record their thinking in the lesson handout). Instructors then continue to facilitate whole-class discussion using the page 1 handout questions. If students are not using devices, the instructor can display the EPA database (and its results for the local water system) on the board.
- Next, the instructor plays the Vox video (starting at 1:37) and the Mayor town hall video for the whole class to watch together.
- The instructor guides students through the remainder of the handout (up to the Discussion Question), allowing students to tackle problems in groups, before bringing everyone back together to discuss their responses. If students are not using devices, they can skip the question in which they’re asked to use the lesson applet to sample a home from Flint. Instead, the instructor can display the applet on the board to gather a larger sample on behalf of the whole class, with students recording the results on their handouts as the instructor gathers the sample.
- After the guided notes, students discuss the Discussion Question in their tables groups and in full-group, with the instructor facilitating. Then, the instructor leads students in completing the Lesson Synthesis. Finally, students proceed to the Practice problems and, eventually, the lesson Mastery Check.
First, download this lesson's slide deck and handout key to see the prompt and sample responses for the Lesson Starter. Then, check out the additional background notes below.
Instructional routine: Ten-Minute Talk. The lesson provides space for students to jot down their thoughts on the prompt, before discussing with a partner and engaging in whole group discussion. You can find more background on implementing a Ten-Minute talk here.
Purpose & Background: In this Ten-Minute Talk, students consider and discuss the different ways that they use their home’s water each day. Bringing to mind how often, and in how many ways, they use their home’s water helps them empathize with the residents of Flint. It will also help students to recognize how high-stakes the Flint Water Crisis was, providing motivation for the lesson’s exploration of water samples in the city. Note: This particular Ten-Minute Talk may take less than 10 minutes. The extra time saved can be used towards extra time on the lesson’s central activity or practice problems.
First, download this lesson's Handout Key and read through its Discussion Question section. Then, check out our model discussion norms and the additional background notes below.
- The Flint Water Crisis provides a powerful example of how statistical inference can be used to shed light on real issues. Encourage students to reflect on why a single sample statistic cannot “prove” a claim but can still provide convincing evidence when interpreted appropriately.
- To clarify that a confidence interval does not give a guaranteed range for the population proportion,emphasize that the interval represents a range of plausible values based on the sample data, rather than certainty about the true proportion. This distinction will become especially important later when students compare confidence intervals and hypothesis tests.
- To ensure that all students understand the circumstances of the Flint Water Crisis, briefly explain that residents became concerned about lead contamination in the city’s water supply after a change in the water source, and that outside researchers used statistical sampling to investigate whether official reports were trustworthy.
- The EPA regulation discussed in the lesson states that no more than 10% of homes should exceed the lead threshold. Students sometimes interpret this as meaning that there is zero lead in the water in the rest of the homes. Clarify that the regulation concerns the proportion of homes above a specified cutoff level, rather than whether any lead is present at all.
- The Virginia Tech study provides a meaningful real-world example of how random sampling and inference can influence public policy decisions. This context helps reinforce that confidence intervals are more than just computational tools – they also allow us to estimate population values in situations involving uncertainty and high-stakes decision making.
- When calculating the confidence interval for a sample proportion, statisticians use the terminology “standard error” \( (\text{SE}_{\hat{p}}) \) instead of “standard deviation” \( (σ_{\hat{p}}) \). The change in terminology signals the use of p̂ (the sample proportion) in place of p (the population proportion) to estimate the variability of the sampling distribution.
- Clarify for students the difference between the interpretation of a confidence interval and the interpretation of the confidence level itself. A confidence interval describes a range of plausible values for the parameter, while the confidence level describes the long-run success rate of the method used to construct the interval. Reinforcing this distinction now will help reduce common misconceptions later in the unit.
- This lesson also helps reinforce the connection between sample size and precision. As students observe narrower intervals resulting from larger samples, they begin developing intuition for how increased sample sizes reduce variability and margin of error. This idea will continue to appear throughout later lessons in the unit.
Student Supports
Lesson-specific resources to support all learners.
- Continue to stress the importance of distinguishing between parameters (which we wish to estimate) and statistics (which we calculate from data). Also emphasize the importance of using correct notation for each. In this case, the parameter is the true proportion (p) of homes with prominent lead. To estimate the parameter, we gather a random sample and find the proportion of homes in that sample (p̂) with prominent lead.
- As students begin to formalize their understanding of constructing a confidence interval for a proportion, it may be helpful to tell students to “assume all conditions are met.” This way, students can get more targeted practice with constructing and interpreting intervals, without delving into the additional step of checking conditions. Once students feel more comfortable with the calculations and interpretations of the intervals, then instructors can ask students to add the checks for conditions as well.
- Vocabulary used in the context of the lesson may include words that are unfamiliar or have several meanings. In particular, the following mathematical terms may need clarification or a definition provided:
- Confidence interval
- Confidence level
- Margin of error
- Sample size
-
In addition, the following contextual terms may need clarification or a definition provided:
- Environmental Protection Agency (EPA)
- Health-Based Violation
- Parts per billion (ppb, in reference to measured lead levels in water)
- To support students in distinguishing the term “confidence interval” from “confidence level,” encourage them to separately identify the interval endpoints, the center, the margin of error, and the confidence level before interpreting the interval in context