Lesson 2.3 - Bias & Nonrandom Sampling

Key Question: Can data about colleges be misleading?
Content: Sampling Bias (Selection, Nonresponse, Voluntary Response) | Response Bias (Question Wording, Self-Reporting)
Video
Course Resources
Resources for teaching our High School Statistics curriculum.
- Lesson Flow - timing and flow of class, using our lesson materials
- Pacing Guide - pacing our units, with daily or block schedules
- Alignment Guide - aligning our lessons to national and state standards for high school statistics
- Classroom Routines - a guidebook of classroom routines embedded within our lessons
Teaching Resources
Resources for teaching with Skew The Script.
- Discussion Norms - our model discussion norms for the classroom
- Letter to Parents - letter to share with parents about our nonpartisan approach
- Teaching Math on Civic Topics - tips for teaching math lessons that cover civic topics
Lesson Notes
Lesson-specific insights from the creators of this lesson.

Many high schoolers are inundated with University recruitment emails and mailers, which often contain seemingly impressive data about the colleges they promote. How are students supposed to separate the wheat from the chaff? In this lesson, students do a deep dive into the types of sampling bias that some colleges utilize in their promotional materials. After the lesson, students walk away with the ability to ask one of the most important questions for any data literate citizen: “That’s nice, but what was your sample?”
- Identify and describe the impacts of sampling bias (selection, nonresponse, voluntary response)
- Identify and describe the impacts of response bias (question wording, self-reporting)
With a good foundation in random sampling methods, students now explore non-random sampling methods – and their tendency towards bias. In this lesson, having students focus on describing where a bias may arise and its consequences is significantly more important (pun intended!) than having them memorize the specific names given to each type of bias. Understanding bias at a conceptual level will help students navigate later inference units, in which they’ll check for bias by checking the conditions for different statistical inference methods.
Before proceeding: Familiarize yourself with the lesson materials linked above (e.g. handout, handout key, slides, video). Then, for additional background and teaching tips from the lesson creators, check out the sections below.
- Consider asking students to bring in examples of college promotional emails or mailers they’ve received that contain data, or grab some from your school’s counselor(s). Using these artifacts to anchor the lesson can help emphasize the relevance of the lesson and of the skills that students learn.
- It’s important to emphasize that Palo Alto College is a community college. One key function of community colleges is to be a stepping stone towards transferring to a four-year college. So, both outcomes described in the lesson – obtaining full-time work and proceeding to the next level of schooling – are considered positive outcomes.
- Precisely naming each type of bias is less important than conceptually understanding the nature of statistical bias. In assessing student responses, we recommend focusing on how students describe the source(s) and impact(s) of bias, rather than focusing on the use of exact terms.
First, download this lesson's slide deck and handout key to see the prompt and sample responses for the Lesson Starter. Then, check out the additional background notes below.
Instructional routine: Which One Doesn't Belong. The Which One Doesn’t Belong (WODB) routine is often a student favorite. Students are presented several options and determine which option does not belong. The key to this routine is in the explanation from students. Because all options could be selected, the reasoning and ability to communicate their choice is what’s important. These are low floor, high ceiling problems that allow for all students to engage. Teachers will receive substantial formative information from students when engaging in this routine.
Purpose & Background: The goal of this Lesson Starter is to start students thinking critically about survey methods. As they look for similarities and differences in the images to determine which doesn’t belong, they are likely to surface ideas about accessibility, question formats, response types, and sampling methods, all of which can be referenced and connected to the lesson’s focus on bias.
First, download this lesson's handout key and read through its Discussion Question section. Then, check out our model discussion norms and the additional background notes below.
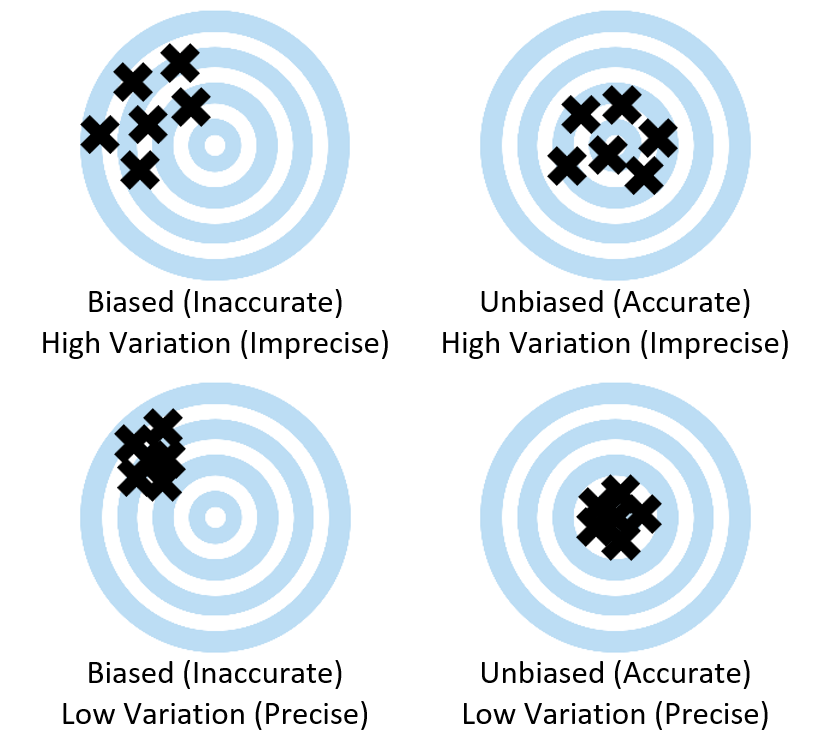
- The relative importance of unbiased estimates vs. precise estimates is a theme that will continue to surface throughout the course, especially as we dive into statistical inference. Spending time here on why unbiasedness is more valuable than precision will help prime students for later conversations in the course.
- A helpful visual connection is the image of the targets from the handout and Lesson Starter slides in the prior lesson (Lesson 2.2). In particular, point students back to the targets in the bottom left corner and upper right corner. Which is better? This comparison makes it clear that it’s better to be “imprecisely right” (unbiased, imprecise) than “precisely wrong” (biased, precise). Hence, a smaller random sample is preferred to a larger nonrandom sample.
- Graduation rate data can be found for almost every U.S. college through the IPEDS website. If there’s a college near your community that shares job placement rates only among graduates, you can use the IPEDS website to look up its graduation rate.
- If the graduation rate at a college closer to your community is relatively low, consider replacing the Palo Alto College example with the more local college, to add extra relevance for students.
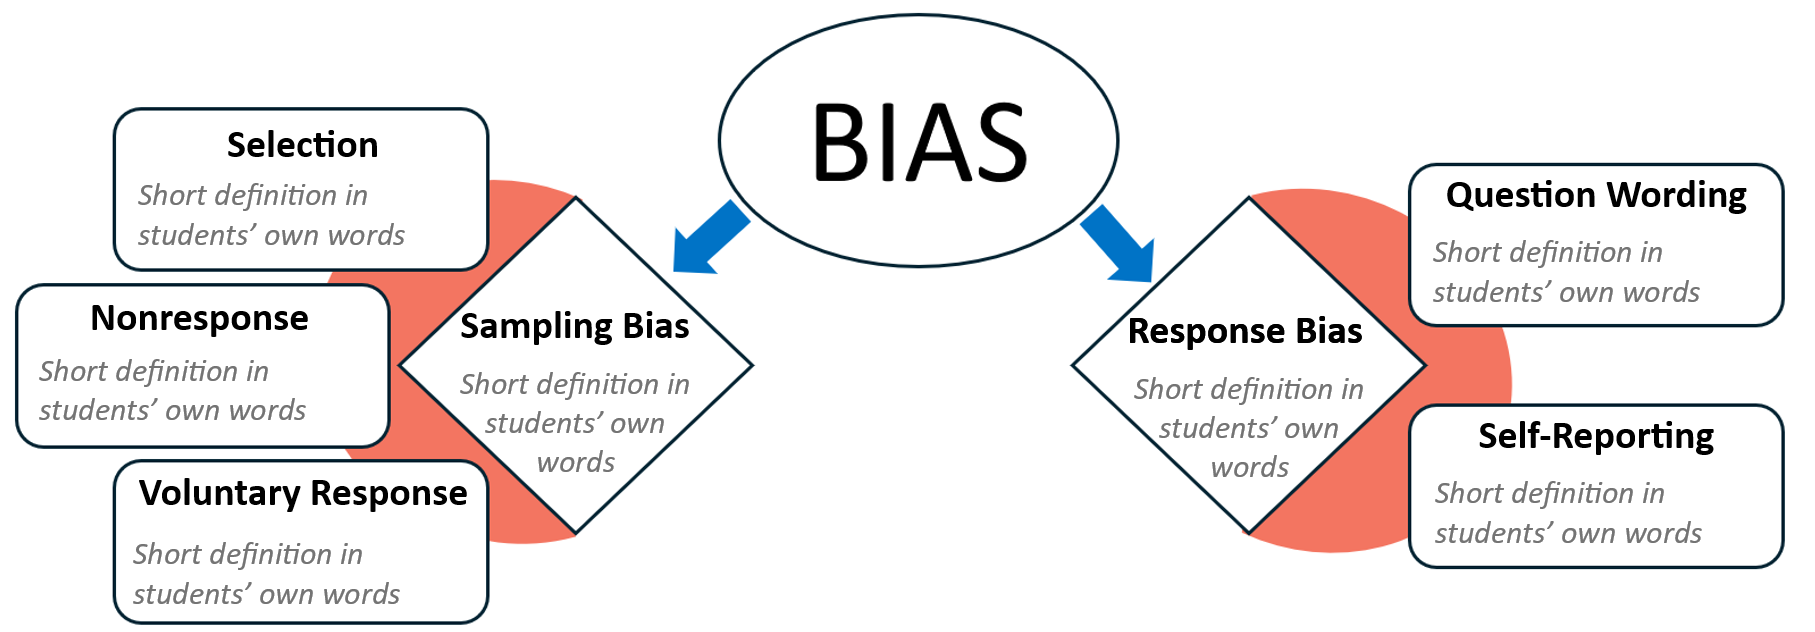
- Use of umbrella terms “sampling bias” and “response bias” is helpful for distinguishing between biases that arise from flawed samples (selection, nonresponse, volunteer response) and those that arise from flawed measurements (question wording, self-reporting). In emphasizing conceptual understanding, accepting such terms with reasoning is likely to be more helpful than requiring rote memorization of exact terminology.
- Even with a random sample, estimates can still suffer from sampling bias. For example, imagine Palo Alto College obtained a random sample of graduates to estimate its job placement rate. Because this random sample was obtained only among the graduates, it will still suffer from selection bias. The bias arises from the universe of possible individuals to sample (all the graduates) not matching the full population of interest (all enrolled students, whether or not they graduated). In statistical terms, the sampling frame (the universe of possible individuals to sample) did not match the full population. Although the term “sampling frame” is outside the scope of this course, learning about sampling frames can be helpful for understanding selection bias.
Student Supports
Lesson-specific resources to support all learners.
- It can be tricky to determine the possible direction of a bias. Guiding students through a small sample size example can be helpful. For instance, ask students to imagine that only 5 people graduated from Rogers State University. Among those, only 1 responded to the survey. That person had found full-time employment. So, the estimate for the job placement rate would be 100%. Is this likely an overestimate or underestimate of the true job placement rate? Why?
- Another support for determining the direction of a bias is to ask students about who is excluded from a sample. Are the people excluded more likely or less likely to have a job? So, for the remaining people in the sample, will they overrepresent or underrepresent the rate of job placement? Why?
- Mathematical Language Routines (MLRs) useful for this lesson: Collect and Display (MLR2) – In this lesson, students may benefit from using a personal version of this routine. Provide them with a graphic organizer (blank copy linked), which can be filled out to look like the following:
- Vocabulary used in the context of the lesson may include words that are unfamiliar or have several meanings. In particular, the following mathematical terms may need clarification or a definition provided:
- Bias
- Sampling Bias
- Selection bias
- Nonresponse bias
- Voluntary response bias
- Response bias
- Question wording bias
- Self-reporting bias
- In addition, the following contextual terms may need clarification or a definition provided:
- Recruit
- Interminable