
Lesson 4.3 - Simulation Test for a Proportion

Key Question: Did “home” teams have an advantage in the bubble?
Content: Hypotheses | P-Values & Simulation | Significance Levels
Teacher Guide
See the video on YouTube.
Course Resources
Resources for teaching our AP® Statistics curriculum.
- Lesson Flow - timing and flow of class, using our lesson materials
- Pacing Guide - pacing our units, with daily or block schedules
- CED Alignment Guide - aligning our lessons to the AP® Statistics Course and Exam Description
Teaching Resources
Resources for teaching with Skew The Script.
- Discussion Norms - our model discussion norms for the classroom
- Letter to Parents - letter to share with parents about our nonpartisan approach
- Teaching Math on Civic Topics - tips for teaching math lessons that cover civic topics
Lesson Notes
Lesson-specific insights from the creators of this lesson.
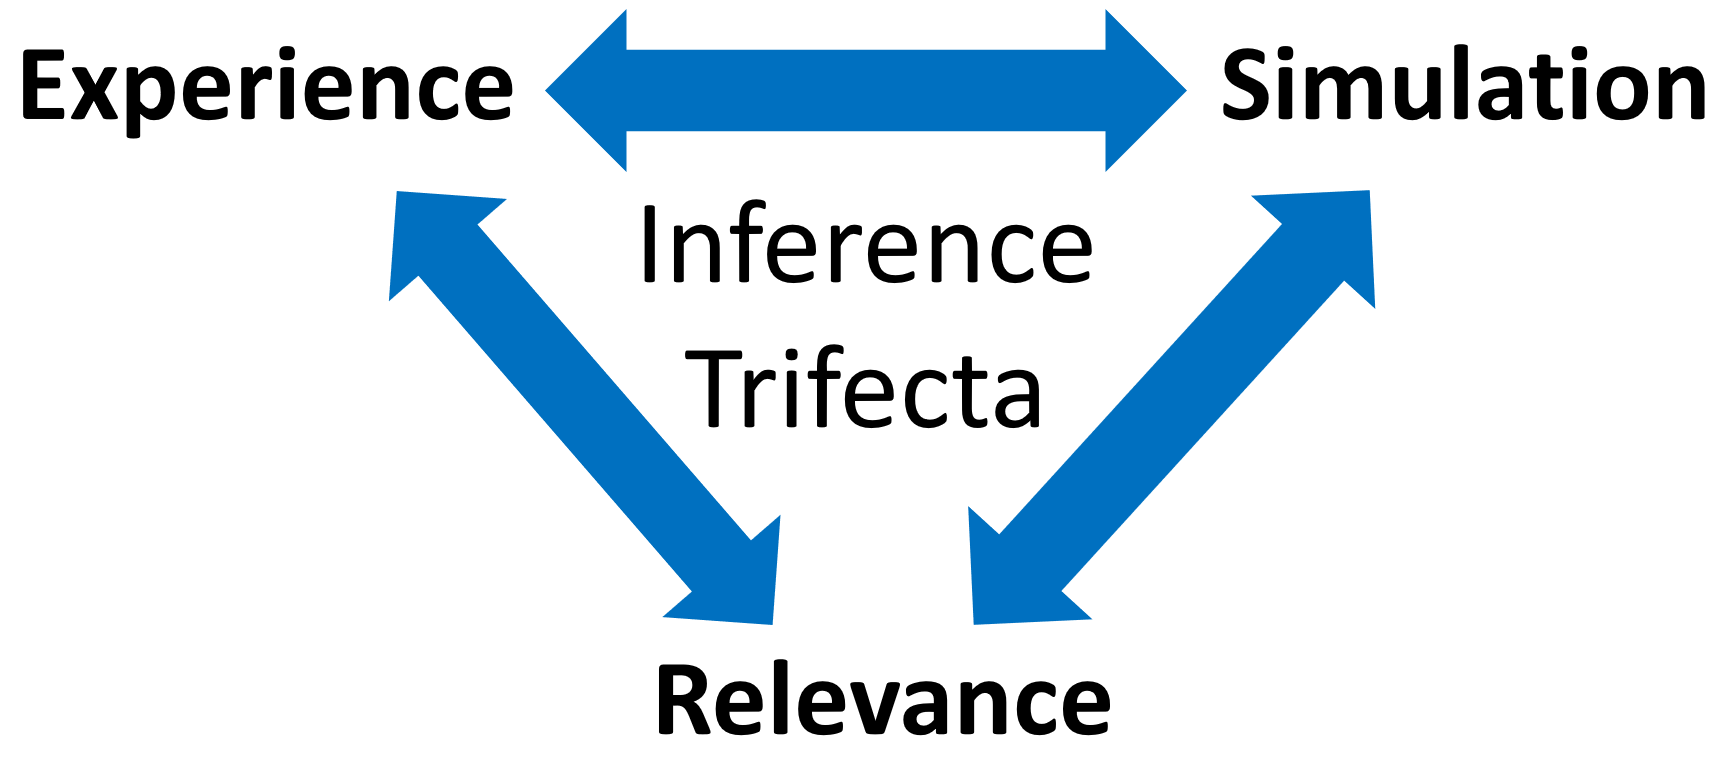
This lesson uses the inference trifecta approach, which differs from our typical lesson format. Before proceeding, watch the Teacher Guide Video above and familiarize yourself with the lesson materials (e.g. handouts and keys). Then, for additional background and teaching tips from the lesson creators, check out the sections below.
- Write and interpret hypotheses
- Estimate p-values from simulations and interpret their meaning
- Conduct a simulation-based hypothesis test for one proportion
In prior lessons, students used simulations to informally evaluate evidence about claims. In this lesson, they formalize those evaluations. To do so, they write hypotheses, empirically estimate p-values from simulations, compare those p-values to significance levels, and then write formal conclusions. In other words, students will now conduct a full hypothesis test for the first time in our course. This test is based on computer simulations, and graphs of simulated results will always be provided to students in this lesson’s practice problems and mastery checks. In the next lesson, students will formalize this process even further by using a normal curve to model the simulation-based results, as they conduct their first parametric hypothesis test: the one-sample z-test for a population proportion.
- Part A of the lesson utilizes the simulations within this Amplify activity to broadly introduce students to the lesson context and the general logic of hypothesis tests. As they complete the activity (with instructor facilitating), students take notes in the Part A handout. See the Activity Guidance section below for more information on leading the activity.
- Part B of the lesson uses our typical lesson format to help students refine their understanding of the logic of hypothesis tests, while also nailing down all the key vocabulary.
- For daily class schedules (45-min class periods), this lesson can be completed in three days:
- Day 1: Activity & Discussion Question from Part A
- Day 2: Guided Notes & Discussion Question from Part B
- Day 3: Practice & Mastery Check from Part B
- For block periods (90-minute class periods), the entire lesson can be completed in 1.5 class days.
- For Part A of the lesson, students complete the Amplify activity (with the instructor facilitating), as they record notes in their handout along the way. To facilitate an Amplify activity, instructors can create an Amplify account (also free) and share a single session code with their students (who can join without accounts).
- When facilitating the Amplify activity, we recommend using the “Sync to Me” pacing option. For more Amplify activity facilitation tips, check out our Amplify/Desmos session with expert Kevin McSorley.
- After the notes, students discuss the Discussion Question in small groups. Then, students discuss in full-group, with the instructor facilitating.
First, download this lesson's slide deck and handout key to see the prompt and sample responses for the Lesson Starter. Then, check out the additional background notes below.
- Instructional routine: This Lesson Starter is a modification of the Would You Rather? instructional routine. In this modification, there are two rounds of student decisions. To keep the timing reasonable, use the first two steps (independent think time and partner sharing) for the first round. Then, in the second round, repeat independent think time before jumping to whole group discussion (including reflection as relevant and as time permits). You can find more background on implementing a Would You Rather here.
- Purpose & Background: The purpose of this Lesson Starter is to get students thinking about home team advantage, which will inform the statistical hypotheses in the lesson. The first prompt in the lesson starter (Slide 1) is provided to offer access to all students, including those with little prior familiarity with basketball or with the idea of home team advantage. In the second prompt (Slide 2), students begin to consider the same scenario through the lens of statistical claims, which provides scaffolding towards the key learning targets of the lesson (constructing and evaluating statistical hypotheses).
First, download this lesson's Handout Key and read through its Discussion Question section. Then, check out our model discussion norms and the additional background notes below.
- It can be helpful to relate the discussion back to the “in a world where” framing we’ve used throughout the unit. Hypothesis tests are framed around this question: “In a world where the null is true, how surprising was our observation?” Imagine that the answer to that question is: “not surprising.” Does that necessarily mean that the null hypothesis is true? No. It just means that, if the null were true, our observation wouldn’t be unusual. Such evidence falls short of definitively proving that the null has to be true.
- Similarly, although it’s not as much of a "statistical sin” as accepting the null, saying that we “accept the alternative” is often frowned upon. It’s generally better to say that we have “convincing evidence” of the alternative hypothesis. Ultimately, statistics is about probabilistic outcomes. Definitive proof is rare. Convincing evidence is more common. Then, as new convincing evidence comes along, we may update our existing assumptions once again.
- When introducing the lesson context, it’s helpful to emphasize how dramatically different the NBA Bubble atmosphere was from a typical stadium atmosphere. Playing regulation games on a closed court without 20,000 screaming fans was an unprecedented experience in the NBA. In addition, ordinarily, visiting teams must travel, stay in hotels, and adjust to a new stadium locker room and routine. In the bubble, everyone was already staying in hotels. No one traveled. And the routine was different for everyone. Emphasizing how unusual it was to no longer have a true “home” team will motivate why the assumption of “no home court advantage” is the null (presumed) hypothesis. Then, the fact that the “home” teams won more games will seem surprising. But how surprising was it? That’s what the results of the hypothesis test will reveal.
- Even though the NBA did not intentionally design an experiment, the league effectively created one by randomly assigning “home” and “away” designations during the bubble season. This situation is called a natural experiment.
- Although not necessary for this lesson, students who are curious may be interested to know that players had mixed feelings about playing in the Bubble and there are a variety of interviews and articles available describing their experiences and sentiments.
- In this course, the null hypothesis is always written in the form parameter = number. However, in general use, null hypotheses for one-sided tests are sometimes written using ≤ or ≥ symbols, with the alternative being an exclusive inequality (< or >) in the other direction. The mathematics behind these approaches generally yield the same results. The difference is mainly one of convention.
- Reinforce that hypotheses are always written about population parameters, which are unknown, rather than sample statistics, which are already known from the data collected. This distinction will continue to be important throughout later inference topics.
Student Supports
Lesson-specific resources to support all learners.
- A common notation error is replacing the parameter symbol with \( \text{H}_0 \) or \( \text{H}_A \). For example, students may forget to write the symbol for the population proportion, p, by just writing: \( \text{H}_0 \)= 0.5. The correct notation is \( \text{H}_0 \): p = 0.5. Note: it’s best to avoid showing the incorrect notation on the board – we just provide it here for clarity on what to look out for in students’ work. Reinforce that hypotheses should always be written using the appropriate population parameter, such as p for proportions. The symbols \( \text{H}_0 \) and \( \text{H}_A \) are only used as labels for the hypotheses themselves, not the quantities being tested.
- Emphasize that there are only two possible conclusions to a hypothesis test: reject \( \text{H}_0 \) or fail to reject \( \text{H}_0 \). Because the test begins by assuming the null hypothesis is true, the conclusion reflects whether the observed evidence is strong enough to challenge that assumption.
- The phrase “as extreme or more extreme” in the definition of a p-value can initially seem unintuitive. It can be helpful to emphasize that hypothesis tests evaluate not only the exact observed result, but also outcomes that would provide even stronger evidence against the null hypothesis.
- Vocabulary used in the context of the lesson may include words that are unfamiliar or have several meanings. In particular, the following mathematical terms may need clarification or a definition provided:
- Hypothesis
- Significance
- Default
- Convincing
- In addition, the following contextual terms may need clarification or a definition provided:
- Home advantage
- Bubble
- It can be helpful to explicitly name that the plural of hypothesis is hypotheses.