
Lesson 4.5 - Conditions for a Normal Approximation
Key Question: What makes polls go wrong?
Content: Random Condition | 10% Condition | Large Counts Condition
Video
See the video on YouTube.
Course Resources
Resources for teaching our High School Statistics curriculum.
- Lesson Flow - timing and flow of class, using our lesson materials
- Pacing Guide - pacing our units, with daily or block schedules
- Alignment Guide - aligning our lessons to national and state standards for high school statistics
- Classroom Routines - a guidebook of classroom routines embedded within our lessons
Teaching Resources
Resources for teaching with Skew The Script.
- Discussion Norms - our model discussion norms for the classroom
- Letter to Parents - letter to share with parents about our nonpartisan approach
- Teaching Math on Civic Topics - tips for teaching math lessons that cover civic topics
Lesson Notes
Lesson-specific insights from the creators of this lesson.
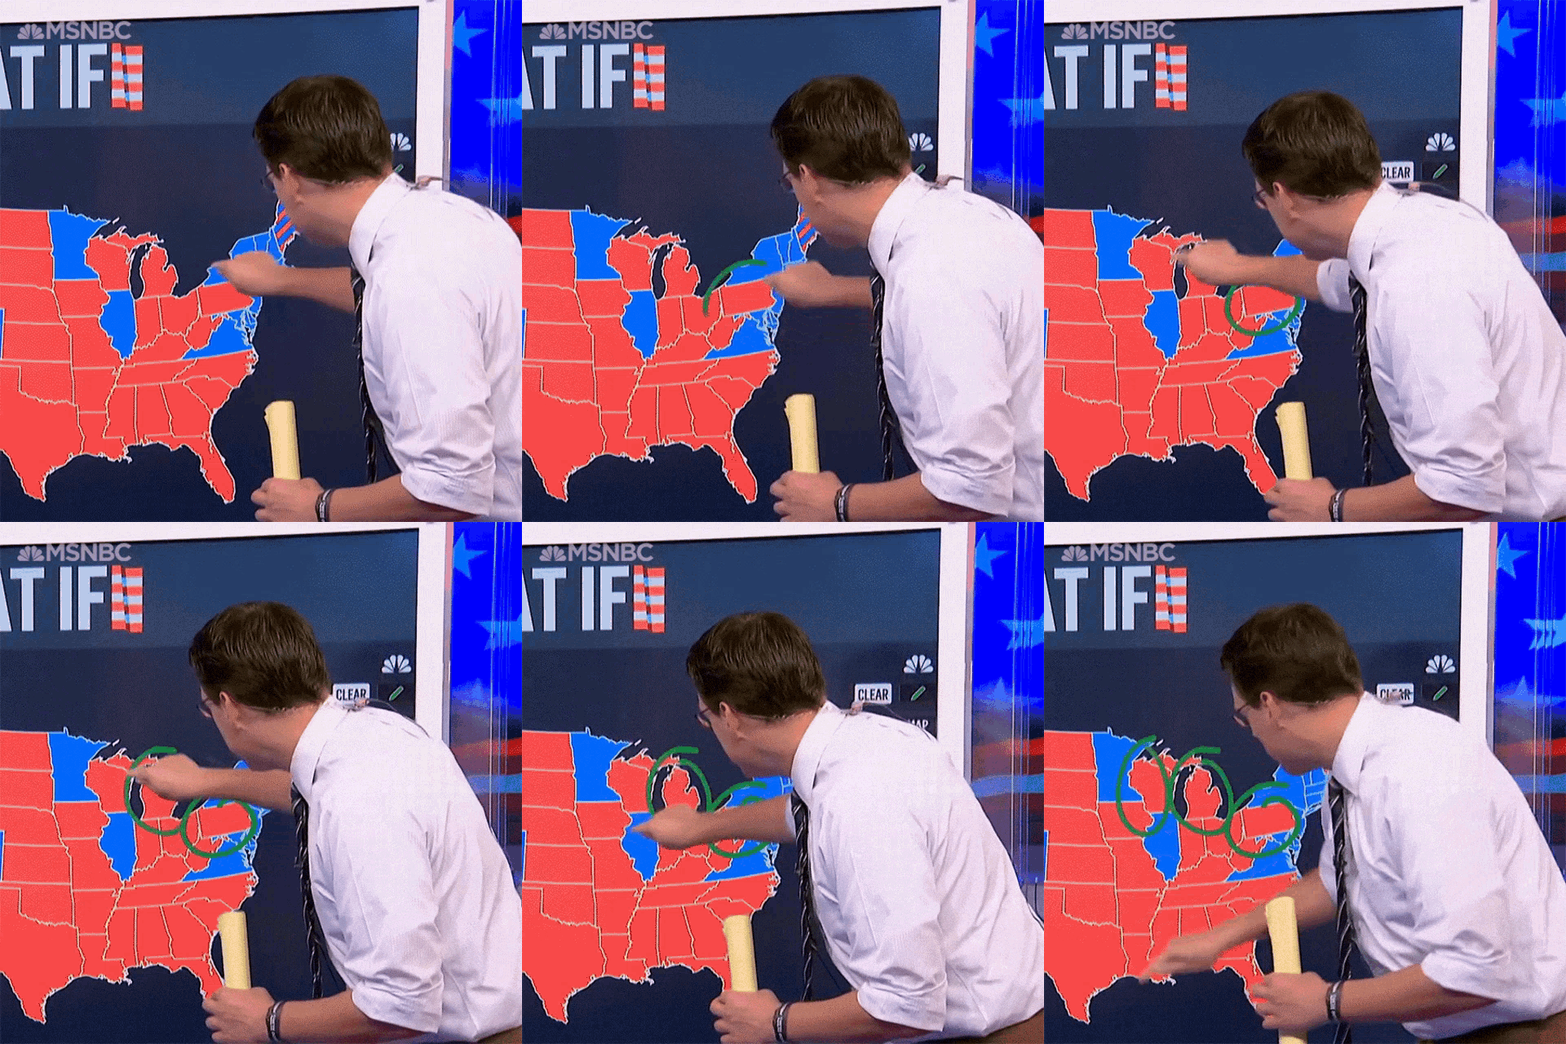
Before election day, pollsters gather samples of likely voters to make election forecasts. Generally, their estimates are reasonable. Other times, they’re wrong – very wrong. In this lesson, students explore the polls that underestimated support for Donald Trump before his 2016 presidential election. Then, using the conditions for sampling proportions, they investigate whether the polls were off by chance – or if their underlying methodology was to blame.
- Describe the random, 10%, and large counts conditions for sampling a proportion
- Check each condition for sampling a proportion
- Describe the consequences of unmet conditions
During students' first forays into hypothesis testing with a normal curve model (Lesson 4.4), the process was simplified by assuming that all necessary conditions were met. In this lesson, students see and test for those conditions, also exploring the potential impact when those conditions are not met. In this lesson and in future lessons, they will be called upon to decide which conditions are necessary and check them as appropriate.
Before proceeding: Familiarize yourself with the lesson materials linked above (e.g. handout, handout key, slides, video). Then, for additional background and teaching tips from the lesson creators, check out the sections below.
- Before fully diving into the random condition, consider taking a moment to have students pause and sit with the full table of polling results from Wisconsin in 2016. Prompt students: “If these polls were conducted well, in what way(s) would this table look different? Would every poll exactly match the true proportion that voted for Trump on election day? Why or why not?” This surfaces the idea that good polling isn’t error-free. Rather, good polling produces unbiased errors. In other words, good polls sometimes overestimate and sometimes underestimate, due to chance. By contrast, in Wisconsin, every single poll underestimated support for Trump. In other words, the errors had a pattern. This pattern is the bias.
- For instructors at schools with fewer than 300 students, the “school” language in the last question of the guided notes can be swapped for “town” or “county” instead. This allows for the 10% condition to be met.
- Students often associate bias with intentional manipulation or political motives, so it is important to distinguish the statistical meaning from the colloquial one. Use the Wisconsin polling example to reinforce the formal statistical definition: a statistic is biased if it systematically overestimates or underestimates the true parameter. Encourage students to consider how issues such as nonresponse, undercoverage, and question wording bias can all contribute to polling bias, even when pollsters are acting in good faith.
- It is important for students to understand not just the conditions they must check, but also why those conditions matter. A firm grasp of the potential impact of these conditions (or their absence) is a key element to grow their future data reasoning and decision making. As such, the concepts surrounding these conditions are inherently more significant than simply verifying them computationally.
First, download this lesson's slide deck and handout key to see the prompt and sample responses for the Lesson Starter. Then, check out the additional background notes below.
Instructional routine: Notice & Wonder. The lesson handout provides a Notice & Wonder T-frame for students to capture their notes and ideas. It is important that students recognize the difference between a noticing (observation) and a wondering (question that comes to mind).
Purpose & Background: The goal of this lesson starter is to introduce students to an important table of polls that they’ll analyze later in the lesson. The table of polls is provided with little context and with the candidates’ names removed. This allows students to focus on the patterns of the polls, without any strong preconceived notions. As students will discover later in the lesson, the table displays 2016 presidential election polls from Wisconsin (as compiled by Real Clear Polling). Every poll put Clinton ahead of Trump. Yet, Trump won the state. In the lesson, students explore why the polls all missed in the same direction.
First, download this lesson's handout key and read through its Discussion Question section. Then, check out our model discussion norms and the additional background notes below.
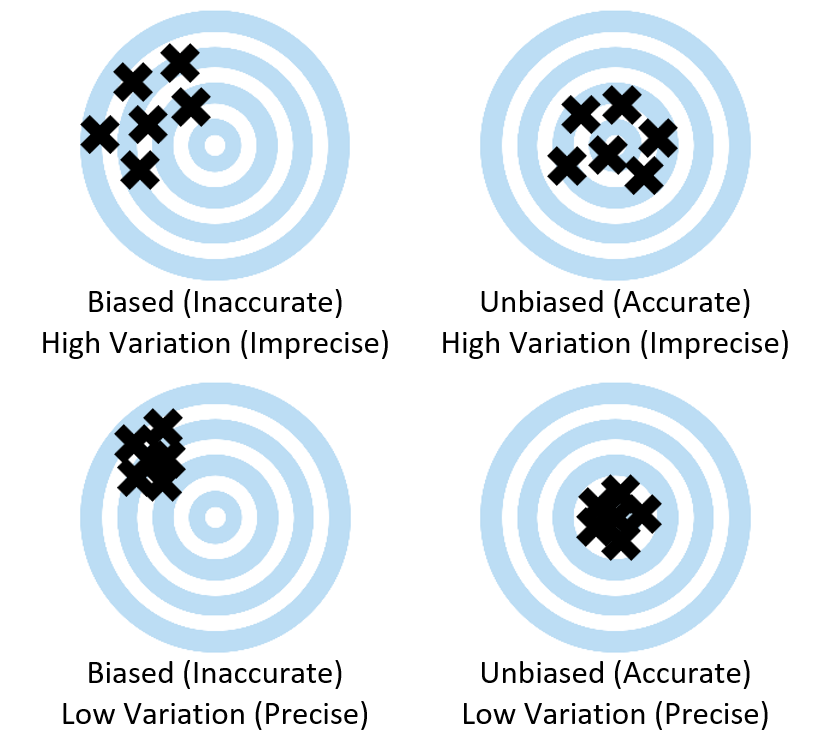
- This lesson’s discussion question is very similar to one from Lesson 2.3, which covered two proposed methods for sampling opinions about housing on a college campus. In that earlier unit, the learning target was for students to identify sampling methods that contain bias. That's still an embedded learning target here, but now there's also a new complicating factor: Students now know that a higher sample size allows for a more precise sampling distribution. So, the challenge for students will be to see that, even if the sampling distribution is more precise, a biased distribution is still worse. Bias is a more important consideration than precision. After all, it is better to be imprecisely right than it is to be precisely wrong!
- For a visual explanation of why reducing bias is more important than reducing spread, this visual aid from Lesson 2.2 can be helpful to display:
- Students may not be aware that polling organizations typically do not contact every individual in a population. Explain that polls rely on samples to estimate population parameters, and that the quality of the estimate depends heavily on how the sample is collected.
- The 2016 U.S. presidential election provides a useful context because it is frequently referenced as an example of polling “failure.” However, many national polls in 2016 were relatively close to the final national popular vote results. It was mainly the state-level polling errors from several key states that affected electoral predictions. This AAPOR post-election analysis report provides additional background on several contributing factors to the bias in some state-level polls, including nonresponse bias, weighting issues, and late shifts among undecided voters.
- Note that this lesson only analyzes results “among major party voters." In other words, all proportions are calculated just among voters from the two major parties. If we were to add third parties, the estimation methods would get more complex (beyond the scope of this course).
- The 10% condition is not required in a randomized experiment because independence is established through random assignment. In an experiment, random assignment helps ensure that treatment groups are comparable and that differences between groups are due to the treatment rather than systematic differences between subjects. So, for experiments, students can simply write: “The independence condition is met because there was random assignment to treatment.”
- In real-world statistical practice, conditions are often viewed less as strict “check boxes” and more as guidelines for determining whether an inference procedure is likely to produce reliable results. Statisticians may evaluate how severely a condition is violated, whether the sample size is large enough to offset the issue, or whether the violation is likely to meaningfully affect the results in a particular setting.
Student Supports
Lesson-specific resources to support all learners.
- Students frequently confuse the large counts condition with the 10% condition because both involve numerical checks. It can help to organize the conditions into a table that identifies the condition name, how it is checked, and the purpose of the condition.
- Consider encouraging students to annotate each condition with a short explanation rather than only performing calculations. For example, students might write “supports independence” next to the 10% condition or “supports approximate normality” next to the large counts condition. This can strengthen conceptual understanding and improve written justifications.
- The 10% condition is checked using n ≤ 0.10(N). If the value of N is not given, students can state that it is reasonable to assume the population is at least 10 times as large as the sample size, unless the context suggests otherwise.
- Vocabulary used in the context of the lesson may include words that are unfamiliar or have several meanings. In particular, the following mathematical terms may need clarification or a definition provided:
- Population proportion
- Sample proportion
- Independent
- Random selection
- Target population
- Sample size
- In addition, the following contextual terms may need clarification or a definition provided:
- Poll
- Candidate
- Forecast