New AP Stats exam, fewer secret codes
By Dashiell Young-Saver (AP Stats teacher, founder of Skew The Script)
Yesterday, the College Board released the new Course and Exam Description (CED) for AP Statistics (effective Fall 2026). The document reveals more information about one of the biggest changes coming to the course: the new format of the Free Response Questions (FRQs) for the 2027 AP Exam and beyond.
After reviewing the document, here’s my take: Three cheers to the College Board. The new FRQ format is very promising and will hopefully minimize secret codes.
What do I mean by “secret codes?” Here’s an example: Imagine you found someone with a PhD in statistics and asked them to “describe the following distribution of class grades.”
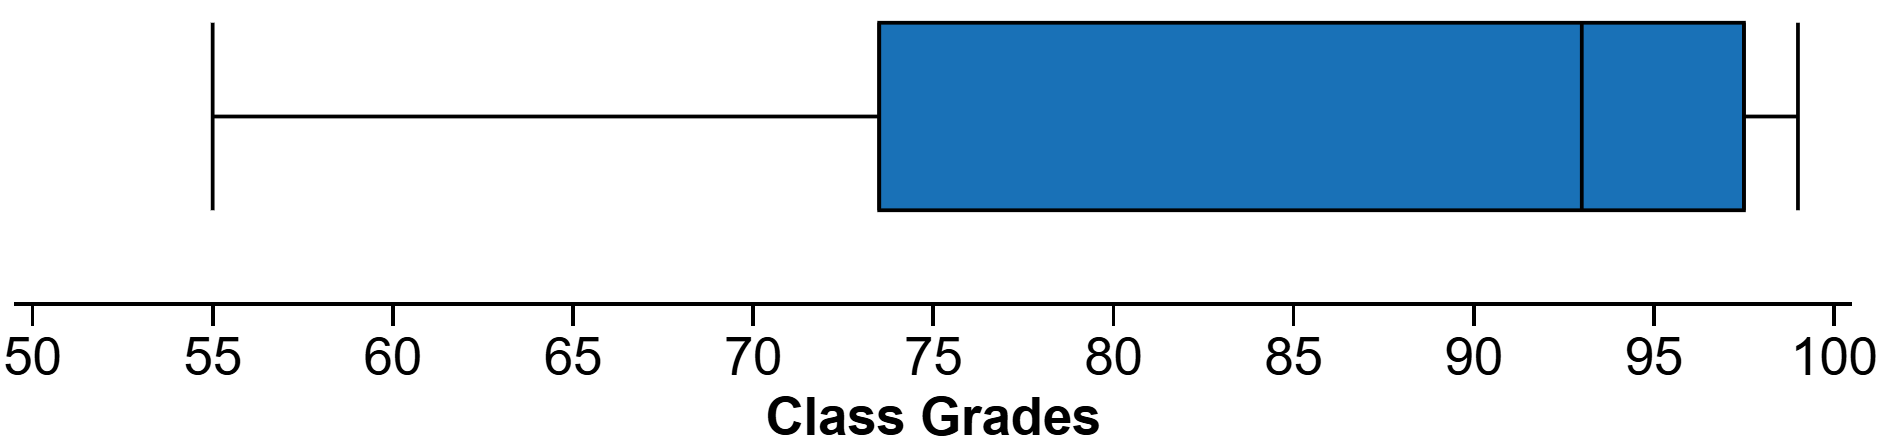
The statistics PhD holder might say something like: “The distribution of class grades is left skew. This might suggest some grade inflation, as it appears that more than half of students have an A in the class. If the purpose of grades is to describe the relative performance of students to one another, this inflation could be concerning. With grades crowding at the top of the scale, there is less room to measure differences in performance between students. That said, if the purpose of grades is to describe student mastery of course content against certain benchmarks (absolute performance instead of relative performance), such grade inflation may not be a concern at all. In fact, the high grades could be a point of celebration.”
In the world of statistical thinking and reasoning, this is a robust and intriguing response to the simple question “describe the distribution of class grades.” However, in the current world of AP Statistics, this response could potentially earn 0 points towards a student’s exam score.
Every AP Statistics teacher knows why. On FRQs in which students are asked to “describe a distribution” of quantitative data, the rubrics generally expect students to comment on 5 items that aren’t specifically requested in the question prompt:
Context
Shape
Outliers or unusual features
Center
Spread
In their response, the person with a PhD in statistics mentioned shape (“left skew”) and context (“class grades”). However, they failed to explicitly discuss outliers (they didn’t say “there don’t appear to be any outliers”), center (they didn’t say “the median is about 93”), and spread (they didn’t say “the IQR is about 24”). With three of five components missing, depending on the strictness of the rubric, they may earn partial credit or no credit for their response.
All exams have some level of a secret code. In AP Statistics, one part of the secret code is that “describe the distribution…” actually means “discuss context, shape, outliers, center, and spread.” If you don’t know that code, you could leave points on the table - even if your response shows great statistical reasoning.
Here’s the promising part of the new FRQ format, which starts for the May 2027 exam administration: there will likely be fewer secret codes. With a 10-point rubric replacing “E-P-I” grading, there’s less room for questions with vague prompts that expect students to list off several unstated subcomponents. Instead, each question has more parts, and each part is more targeted.
As an example, take a look at Part D of the first released FRQ in the new CED. The question explicitly asks students to describe the shape. There’s certainly much less of a secret code there. Even better, take a look at Parts C & D of the second released FRQ. Students are asked to compare the relative distances between Q1, the median, and Q3. Then, they use this comparison to reason about symmetry and different measures of center and spread. In general, AP Statistics classrooms usually don’t provide specific instruction on how to determine shape from the relative distances between Q1, the median, and Q3. However, if students have learned about skew and symmetry at a conceptual level, they’ll be able to apply their conceptual understanding to this problem and complete it successfully.
Sure, these questions will result in less writing on the page than we’d expect from the classic “describe the distribution” prompt. But I’d argue that the second question is not only more clear than a “describe the distribution” question - it’s also slightly more rigorous. Rather than a template response from a secret code, students are asked to apply the concepts they’ve learned in a potentially new way. This shift in the exam allows teachers and curriculum writers to focus less on having students memorize acronyms for basic recall (like SOCS - Shape, Outlier, Center, Spread), freeing up class time to better understand each component conceptually.
Now, let me be very clear about this: One big reason I loving teaching AP Statistics is that its assessment already tests conceptual understanding and critical thinking at a much deeper level than the vast majority of standardized math assessments you’ll find in K12 education. The classic AP Statistics FRQs are awesome, and we all owe the original test designers a huge debt of gratitude. Thank you to all the great minds who worked hard to create an exam format that has stood the test of time for almost 30 years and helped galvanize the effort to provide college-level statistics education in K12 schools. All of us in the AP Stats teaching community truly stand on the shoulders of giants.
I’m also glad to say I’m excited about the additional innovations coming to the new exam format in May 2027 and beyond. Of course, the key will be in the implementation. We’ll see if the exam writers will be able to minimize secret codes and maximize rigor in the questions they write for future years. But, based on what I’ve seen so far, I’m already on the hopeful side.
Of course, at Skew The Script, the new FRQ format is top-of-mind as we prepare our revised AP Statistics curriculum for launch in June 2026. Stay tuned and get notifications about the new materials by joining our email list.