
Lesson 4.A.4 - Hypothesis Test for a Mean
Key Question: Does SNAP adequately cover the cost of food?
Content: t-Test Statistic | One-Sample t-Test for a Population Mean
Alignment: CED Topics 4.4-4.5
Video
See the video on YouTube.
Course Resources
Resources for teaching our AP® Statistics curriculum.
- Lesson Flow - timing and flow of class, using our lesson materials
- Pacing Guide - pacing our units, with daily or block schedules
- CED Alignment Guide - aligning our lessons to the AP® Statistics Course and Exam Description
Teaching Resources
Resources for teaching with Skew The Script.
- Discussion Norms - our model discussion norms for the classroom
- Letter to Parents - letter to share with parents about our nonpartisan approach
- Teaching Math on Civic Topics - tips for teaching math lessons that cover civic topics
Lesson Notes
Lesson-specific insights from the creators of this lesson.

In this lesson, students analyze SNAP – the Supplemental Nutrition Assistance Program, often referred to as “food stamps.” Specifically, given the rising cost of food, students investigate whether SNAP provides enough funds to cover the average cost of a basic monthly bundle of groceries. Then, students are challenged to look beyond the average, as they explore individual regions where SNAP may provide a surplus or fall short.
- Calculate and interpret a t-test statistic
- Check conditions for a one-sample t-test for a population mean
- Conduct a one-sample t-test for a population mean
Before proceeding: Familiarize yourself with the lesson materials linked above (e.g. handout, handout key, slides, video). Then, for additional background and teaching tips from the lesson creators, check out the sections below.
- Rather than delving into perspectives on the merits of food stamps, we recommend that instructors center classroom conversation on the statistical question at the heart of this lesson: Do SNAP funds fully cover the average cost of a basic monthly bundle of groceries? Concentrating on this empirical question – along with the broadening of the analysis during the lesson’s Discussion Question – will lead to more focused and data-informed conversations.
- This lesson provides an opportunity to emphasize the common structure of inference, rather than presenting the one-sample t-test as an entirely new procedure. Encourage students to identify what remains familiar from earlier hypothesis tests. For example, the “in a world where the null hypothesis is true…” framing should be familiar. Then, encourage students to identify what changes when the parameter of interest is a population mean.
- When discussing the t-test statistic, connect it explicitly to students’ prior understanding of standardized scores. Like a z-score, the t-test statistic measures a distance from a reference value in standardized units. Here, it describes how many estimated standard errors the observed sample mean falls above or below the null hypothesis mean.
First, download this lesson's Handout Key and read through its Discussion Question section. Then, check out our model discussion norms and the additional background notes below.
- The Discussion Question provides an opportunity to emphasize the scope of the conclusions we can make from the hypothesis test. The hypothesis test addresses whether the maximum SNAP allotment for a one-person household covers the mean price of the grocery bundle. However, individual prices vary across stores, and not every SNAP participant receives the maximum allotment. Even if the maximum allotment covered the mean price, it could still fall short for individuals who receive less than the maximum or who shop at stores where prices are higher. In addition, for individuals who shop in regions with lower prices, the SNAP allotment may provide a surplus.
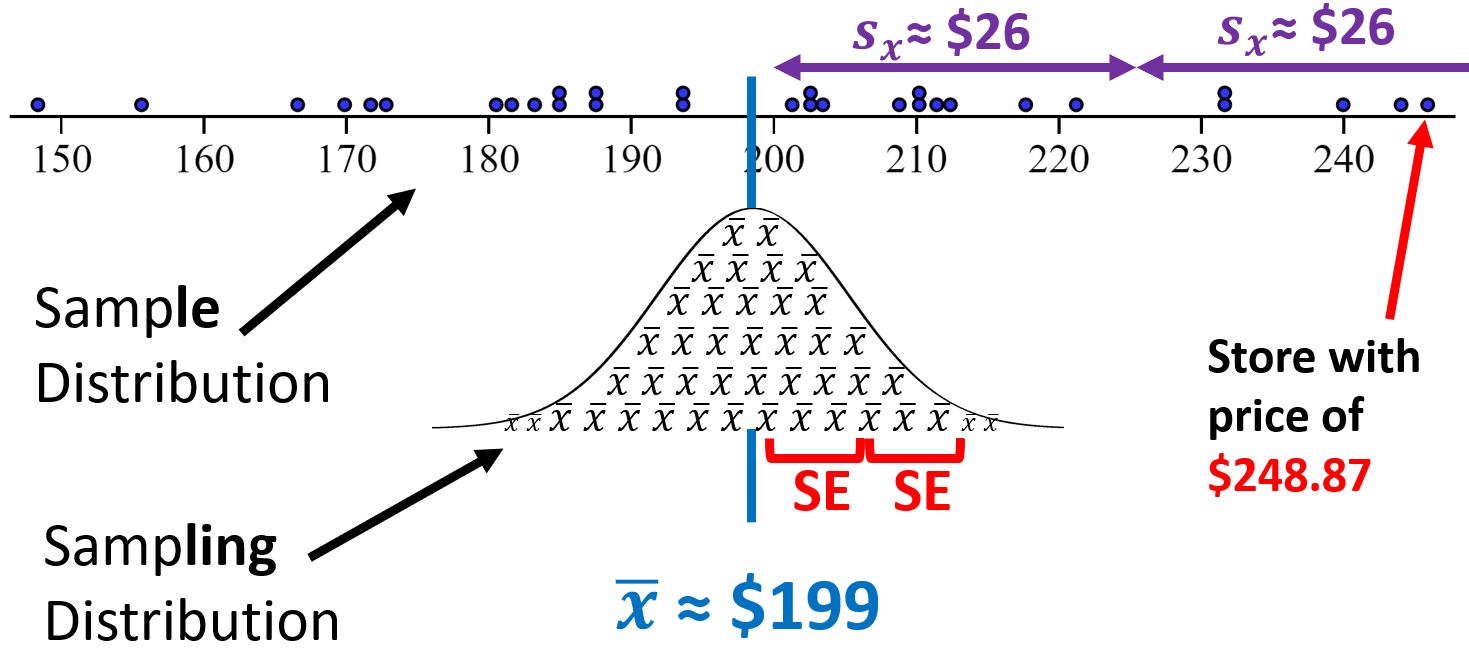
- Below is a simulated set of data with the same summary statistics as the data from our sample (x̄ = $199, s = $26), along with the sampling distribution for the mean underneath. The prices of $248.87 of $148.12 are both approximately 2 standard deviations away from the mean, so they’re not incredibly unusual. Displaying this visual in class provides an excellent opportunity to reinforce the difference between the sampling distribution and the sample distribution. The sampling distribution is a theoretical distribution of possible means. It has small standard errors because it measures variation in means (not variation in data). The sample distribution is the collection of individual data values (prices). Its standard deviation shows the variation in the data itself.
- SNAP maximum allotments are based on the USDA’s Thrifty Food Plan, an estimate of the cost of purchasing food for nutritious, low-cost meals prepared at home. The cost of the plan is used to establish maximum SNAP allotments, with adjustments for household size.
- The lesson uses data from 2020, before later USDA reevaluations of the Thrifty Food Plan. Changes over time, along with adjustments for inflation, have resulted in increased SNAP maximum allotments. Teachers should therefore treat the $194 SNAP allotment in 2020 – referenced in the lesson – as a historical benchmark specific to the period represented by the data, rather than as a current SNAP benefit level. Note: The grocery prices from the lesson were gathered in 2020 as well, so students are comparing the 2020 allotment to 2020 grocery prices.
- Instructors and students can update and localize the data for this lesson by gathering grocery prices from randomly sampled stores in their region. For example, instructors can use Google Maps to compile a comprehensive list of grocery stores in the same city or county as their school. Then, a random number generator can be used to select 30 random stores from the comprehensive list. Students can help look up the price of the basic grocery bundle at each of the chosen stores, by visiting each store’s website. Finally, after the prices are compiled, the sample average price can be compared to the current maximum SNAP allotment.
- The t-distribution arises because the population standard deviation σ is unknown and must be estimated using the sample standard deviation s. Because s varies from sample to sample, this introduces additional uncertainty, producing the heavier tails of the t-distribution. As the sample size increases, s becomes a more reliable estimate of σ, and the t-distribution approaches the standard normal distribution.
- A confidence interval and a two-sided hypothesis test are two ways of looking at the same statistical evidence. At complementary significance and confidence levels, such as 5% and 95% respectively, a two-sided t-test will reject the null hypothesis when the corresponding confidence interval does not contain μ0. In the example covered by this lesson, the 95% confidence interval for the mean grocery bundle price would be about ($190, $209). Because this confidence interval contains μ0 = $194 (the SNAP allotment), the interval is consistent with our hypothesis test’s conclusion of failing to reject the null.
Student Supports
Lesson-specific resources to support all learners.
- Encourage students to repeatedly return to the question, “What would we expect to see in a world where the null hypothesis is true?” In this lesson, that means the question becomes: “What would we expect to see in a world where the true mean price of the grocery bundle is $194?”
- Continue reinforcing that failing to reject H0 does not establish that H0 is true. In this context, the data do not provide convincing evidence that the true mean grocery cost exceeds $194. However, this does not establish that the true mean cost is exactly $194. It just means that we don’t have convincing evidence that the true mean is substantially higher than that value.
- Vocabulary used in the context of the lesson may include words that are unfamiliar or have several meanings. In particular, the following mathematical terms may need clarification or a definition provided:
- Test statistic
- Standard error
- Degrees of freedom
- In addition, the following contextual terms may need clarification or a definition provided:
- Supplemental Nutrition Assistance Program (SNAP)
- Allotment