Lesson 1.B.2 - Random Sampling
Key Question: What is "middle income" in your city?
Content: Simple, Stratified, Cluster, & Systematic Random Samples | Bias vs Variation
Alignment: CED Topic 1.11
Teacher Guide
Course Resources
Resources for teaching our AP® Statistics curriculum.
- Lesson Flow - timing and flow of class, using our lesson materials
- Pacing Guide - pacing our units, with daily or block schedules
- CED Alignment Guide - aligning our lessons to the AP® Statistics Course and Exam Description
Teaching Resources
Resources for teaching with Skew The Script.
- Discussion Norms - our model discussion norms for the classroom
- Letter to Parents - letter to share with parents about our nonpartisan approach
- Teaching Math on Civic Topics - tips for teaching math lessons that cover civic topics
Lesson Notes
Lesson-specific insights from the creators of this lesson.

This lesson was made through collaboration with Julia Koschinsky, Nicholas Marchio, & Nikhil Patel from The University of Chicago Center for Spatial Data Science.
This lesson differs from our typical lesson format. Before proceeding, watch the Teacher Guide Video above and familiarize yourself with the lesson materials (e.g. activity handout and key). Then, for additional background and teaching tips from the lesson creators, check out the sections below.
- Identify and describe different random sampling methods
- Evaluate the tradeoffs between different random sampling methods
- Distinguish between bias and variation
- The lesson is broken into two class days (for 45-minute class periods):
- Day 1: Activity
- Day 2: Post-Activity Notes & Mastery Check
- For block periods (90-minute class periods), both portions can be completed on the same day.
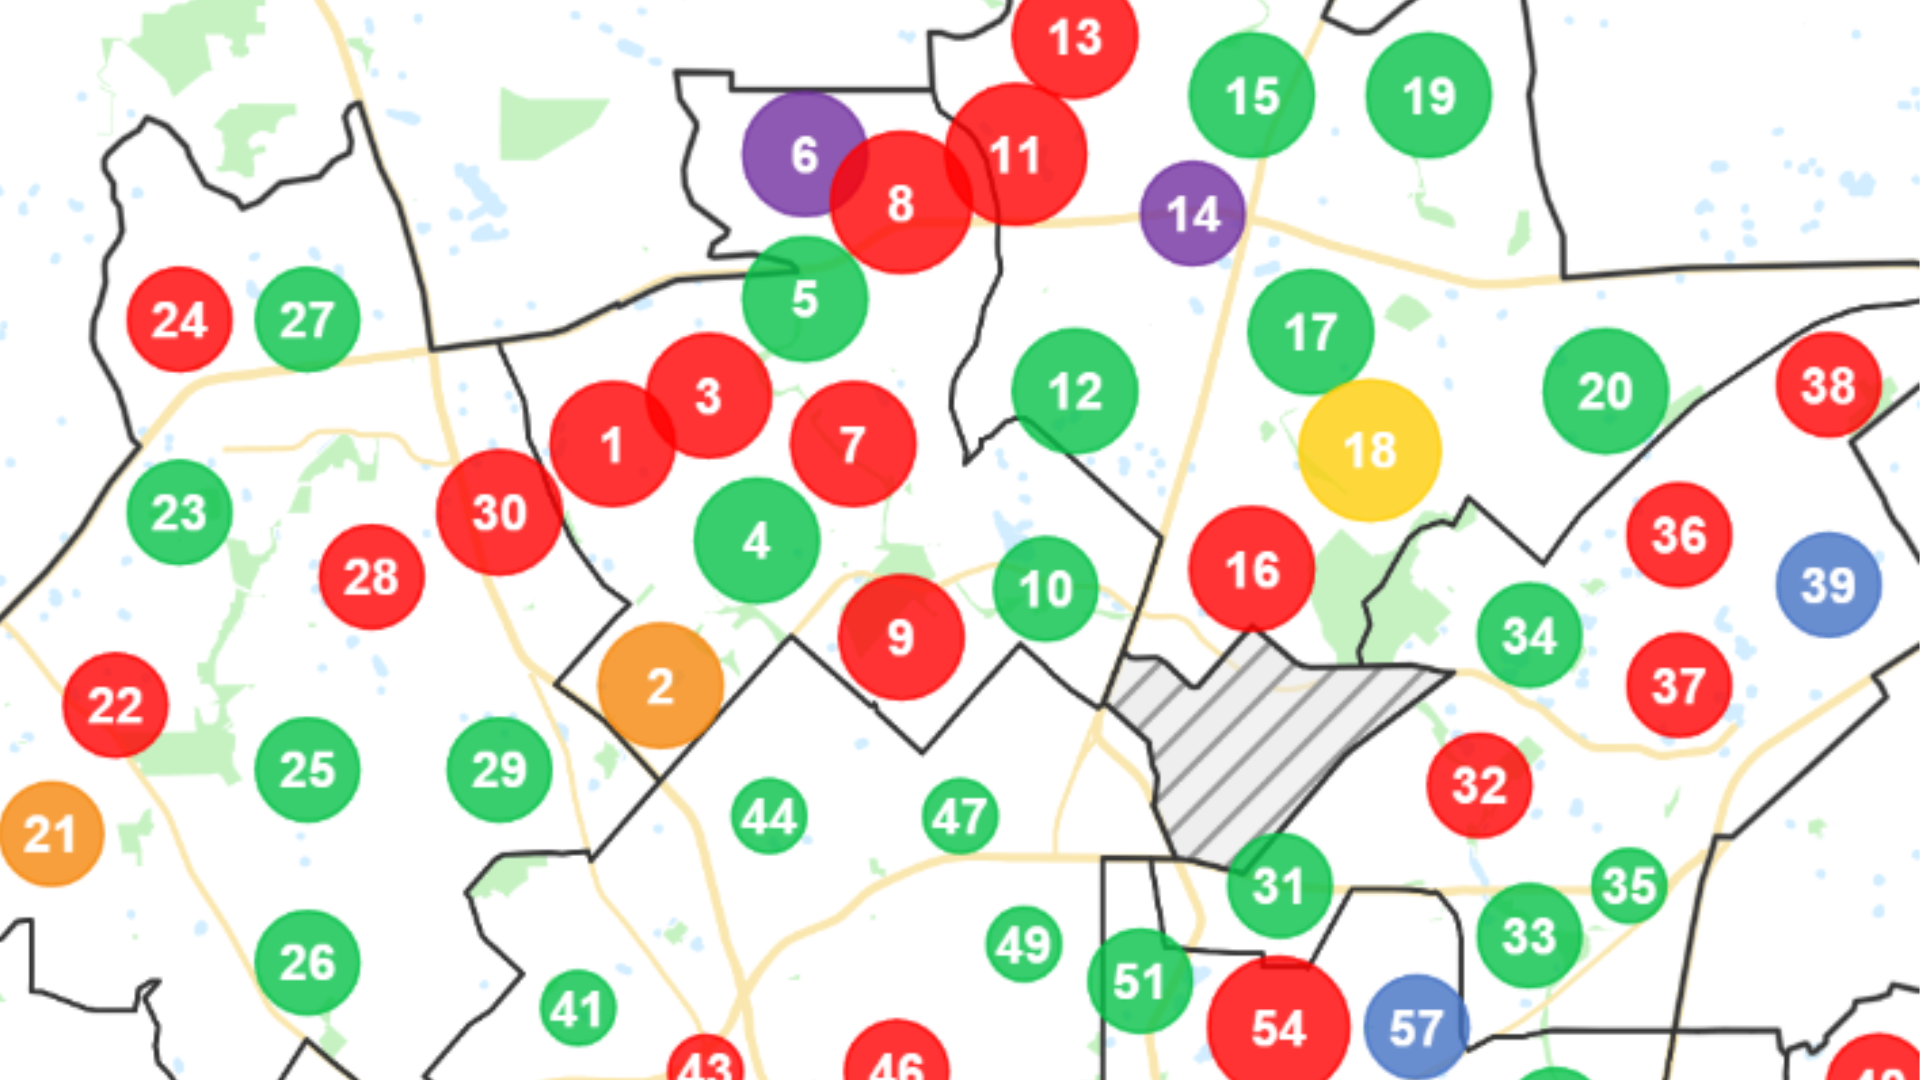
- Each student should have a printed activity handout and map handout. For the activity, use the map handout for the city that’s closest to your school or that would be most recognizable for your students.
- The teacher should have the activity handout key, map handout key, and a clean copy of the map handout. The activity works best if there are at least 20 students in class. For class sizes below 20, have each student perform each sampling method twice.
- Before jumping in, show page 1 of the map handout under a document camera. Annotate your school’s location (if applicable) and key landmarks on the map, so that students can orient themselves.
- Proceed through each sampling method in the activity handout. This entails 3 steps for each sampling method:
- Students read the directions for the sampling procedure on the activity handout.
- Students perform the sampling procedure. They use the map handout (pg 1) to gather their sample. Then, they write all income values and their sample median in the space under the sampling procedure directions (activity handout)
- After every student has found their sample median, have each student one-by-one read out their sample median. As they do this, create a dotplot of their sample medians on the final page of your clean copy of the map handout (pg 3). Do this under a document camera so that the rest of the class can fill it out at the same time on their own copies. An example dotplot and the population median are shown on the final page of the map handout key.
- Once the class has finished each sampling method, it’s time to reveal the true median income in the population of all 100 homes! To find the city’s population median, find the blue line on the last page of the city’s map handout key. This population median is the true median of the 100 households on the map, and it will be close to (if not exactly) the true median household income in the city (as of the 2020 census). Under the doc cam, draw a vertical line down the last page of the map handout to represent this population median. Have students do the same. Then, have students answer the final questions in the activity handout.
- Students can generate random numbers for the activity using random.org (instructions), Desmos (instructions), Numworks calculators (instructions), TI-84 calculators (instructions), or TI-Npsire calculators (instructions). For ease of use, we recommend using random.org – it works the best with our students!
- Calculators cannot generate truly random numbers. Instead, they generate pseudorandom numbers. The difference between random and pseudorandom is outside the scope of this course, but the main take away is this: to ensure that students get different strings of “random” numbers from their peers, students using Texas Instruments calculators need to set a unique “seed” or unique starting point for their calculator’s number generating process. Have students set the seed in their calculator to some arbitrary number that’s unique to them (e.g. instruct them to choose a 4-digit number that only they would choose). They only need to do this once at the beginning of the session. Here are instructions for setting the seed on TI-84 and TI-Nspire.
- The maps are based on data from the 2020 census. The representative homes were generated to match city-level data (e.g. racial distribution in city) and tract-level data (e.g. income distribution in each neighborhood). The full code and map-making methods are shown here.
- The city boundaries are the true municipal boundaries of the city (not the county or metropolitan area). The within-city region boundaries were generated to create 10 population-balanced subregions of the city.
- The maps for this lesson were created in collaboration with the Center for Spatial Data Science at the University of Chicago (Julia Koschinsky, Nicholas Marchio, & Nikhil Patel).
Student Supports
Lesson-specific resources to support all learners.
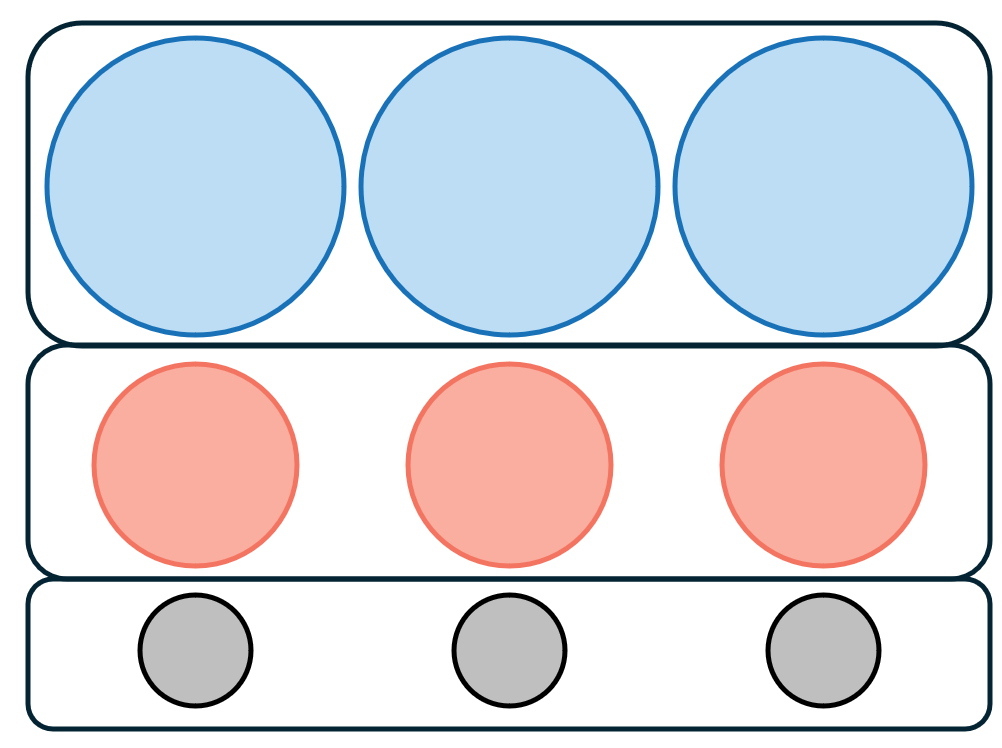
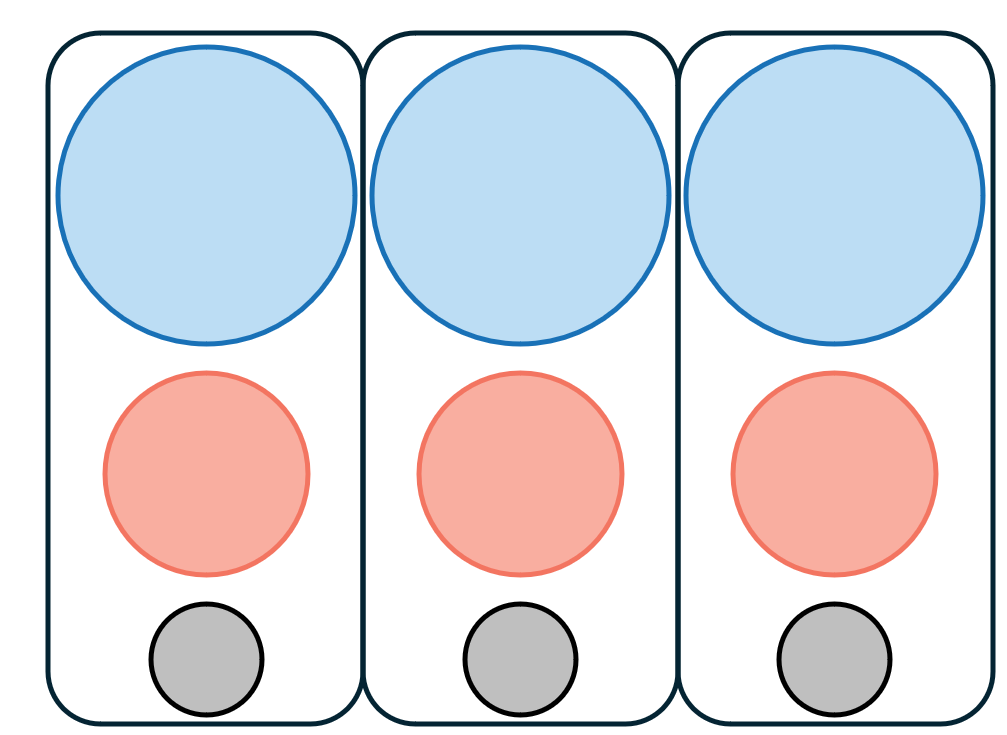
- This lesson’s most nuanced concept is why homogenous groups are advantageous for stratified random sampling and disadvantageous for cluster random sampling. A diagram here can be helpful. Show students the image of circles below. Then ask them: to get a representative sample of circle sizes, which method should be used: stratified random sampling or cluster random sampling? Why?
- Then, ask students to take a look at the same diagram, but with different groupings. Now which method should be used: stratified random sampling or cluster random sampling? Does it matter? Explain.
- Vocabulary used in the context of the lesson may include words that are unfamiliar or have several meanings. In particular, the following mathematical terms may need clarification or a definition provided:
- Bias
- Precision
- Variation
- Judgement Sample
- Simple Random Sample
- Cluster Random Sample
- Stratified Random Sample
- Systematic Random Sample
- In addition, the following contextual terms may need clarification or a definition provided:
- Middle Income / Middle Class
- Neighborhood
- It can be helpful to distinguish the mathematical/statistical definition of “bias” from its more commonly used meanings. In statistics, bias refers to the tendency of a sampling method to systematically over or underestimate a parameter’s true value.