Lesson 2.B.4 - Normal Calculations
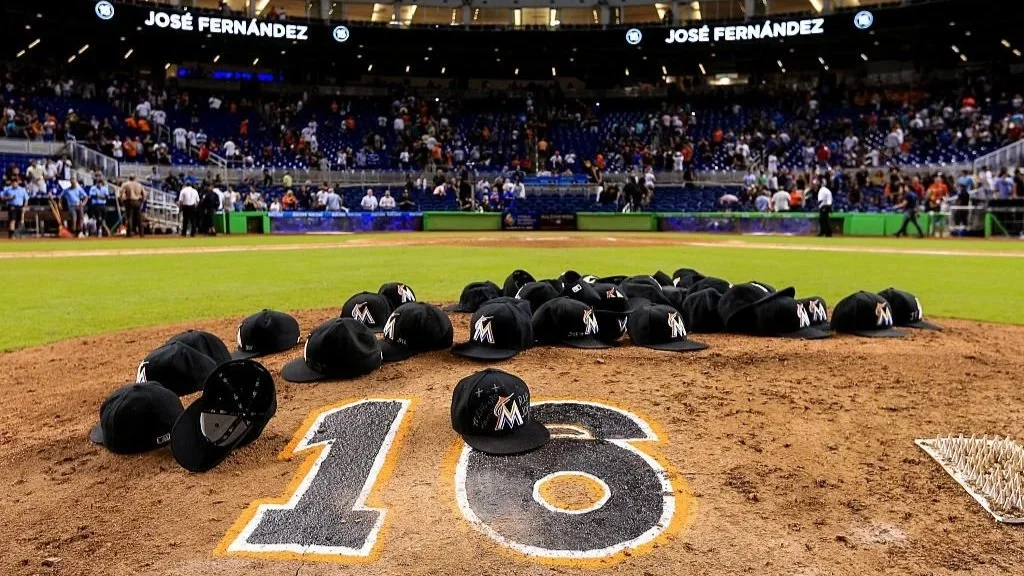
Key Question: What role did the pitcher play in the Marlins Miracle?
Content: Finding areas & values in normal curves
Alignment: CED Topic 2.11.E-2.11.F
Video
Course Resources
Resources for teaching our AP® Statistics curriculum.
- Lesson Flow - timing and flow of class, using our lesson materials
- Pacing Guide - pacing our units, with daily or block schedules
- CED Alignment Guide - aligning our lessons to the AP® Statistics Course and Exam Description
Teaching Resources
Resources for teaching with Skew The Script.
- Discussion Norms - our model discussion norms for the classroom
- Letter to Parents - letter to share with parents about our nonpartisan approach
- Teaching Math on Civic Topics - tips for teaching math lessons that cover civic topics
Lesson Notes
Lesson-specific insights from the creators of this lesson.
The day following the tragic death of star pitcher José Fernández, his team (the Miami Marlins) had to play a baseball game. The atmosphere at the stadium was somber. Dee Gordon, one of Fernández’s best friends on the team, was the first Marlins batter to step up to the plate. He had not hit a home run all season, in over 300 at-bats. Yet somehow, on that dark day, Gordon did this. The uplifting moment became known as the Marlins Miracle, and it inspired millions of viewers across the country. But, it turns out, there may be even more to this miracle than meets the eye. In this lesson, students explore whether there’s another potential hero in this story – a hero that can only be revealed through statistical analysis.
- Calculate normal curve areas/probabilities, when given normal curve values
- Calculate normal curve values, when given normal curve areas/probabilities
- Justify a claim using a normal curve calculation
Before proceeding: Familiarize yourself with the lesson materials linked above (e.g. handout, handout key, slides, video). Then, for additional background and teaching tips from the lesson creators, check out the sections below.
- To fully engage students in the story behind this lesson, it’s worth spending the time to play the videos of the atmosphere before the game and the miracle moment. After seeing the emotions of the announcers and Fernández’s teammates, students will be fully invested in the story and in answering the lessons’ Key Question. Just make sure to have some tissues on hand as Dee Gordon rounds the bases.
- This lesson positions students to use z-scores and the standard normal curve (µ = 0, σ = 1) for all their normal calculations. However, students may be tempted to perform all their calculations using a normal curve that matches the original scale of the data (µ = 89.4, σ = 1.7). Then, z-scores would no longer be necessary. So, why ask students to calculate z-scores? Because when students develop an intuitive understanding of what constitutes an “unusual” z-score (usually more than 2σ away from the mean), they’ll better internalize what constitutes an “unusual” z-test statistic in later inference units. By having students work with z-scores and normal curves now, we’re positioning them to more easily grasp the logic and formulas of hypothesis tests later in the year.
- Establish the expectation that students sketch a normal curve to make sense of each problem first, before turning to technology. A sketch helps students identify the mean, scale, and relevant region under the curve before performing any calculations. This not only reduces common setup errors, such as incorrect bounds or tail selection, but also helps students interpret whether their answers are reasonable. In addition, drawing and labeling a curve provides a clear way for students to show their thinking, which is expected on the AP exam.
First, download this lesson's Handout Key and read through its Discussion Question section. Then, check out our model discussion norms and the additional background notes below.
- A natural way to extend the discussion is to ask: “How low would this probability have to be to convince you that Colón purposefully threw an easy pitch? What’s your cutoff?” Allowing students to share their own cutoff values – e.g. 1%, 5%, 10% – helps build intuition for establishing a significance level (the cutoff for rejecting a null hypothesis) in later units.
- Another extension to build intuition for later units is to ask students: “Do these results convince you that Colón purposefully threw an easy pitch? Do the results provide irrefutable proof that Colón purposefully threw an easy pitch?” Although the conclusion that Colón purposefully threw an easy pitch is convincing, it’s not irrefutably proven. There is a probability (1.5%) that he would throw a pitch this slow (or slower) by chance alone. Even though that’s a small chance, the probability of throwing a pitch this slow is not 0%. Building this intuition will also help students in later inference units, in which they’ll be expected to draw conclusions about hypothesis tests in non-determinative language.
- It’s helpful to conclude the discussion with the note that Colón’s “easy” pitch doesn’t take away from the power of the Marlins Miracle. In fact, it adds to it. We’re at our best when we collaborate and cooperate across lines of difference – including across opposing teams. The power of the moment comes from people working together for a greater cause: in this case, to honor a fallen friend.
- Purposefully throwing an easy pitch isn’t new in baseball. In fact, it has a name: grooving a pitch. Pitchers are known to groove pitches when the moment calls for it. For example, grooved pitches are often used as “parting gifts” during the last at-bats of great hitters retiring after a long career. There is an unwritten rule though: if you groove a pitch, you never talk about it. Otherwise, you may diminish the hitter’s accomplishment. By never discussing his pitch to Gordon, Colón upheld this unwritten rule.
- This context highlights how statistics can be used to interpret a single unusual event. Encourage students to reflect on how an improbable outcome, such as Dee Gordon’s home run, can lead people to question whether something occurred by chance, while recognizing that rare events can still occur.
- If time permits, consider asking students to propose other scenarios in sports or real life where unusually rare events might lead people to question whether something occurred by chance. This can help reinforce the broader applicability of normal calculations.
- Reinforce that the letter Z is used only for the standard normal distribution. For other normally distributed random variables, letters such as X, Y, or W are typically used. Highlighting this distinction helps students interpret probability statements more precisely and helps set them up for interpreting z-test statistics in later inference units.
- Emphasize that the sign of the z-score is critical. A positive z-score indicates a value above the mean, while a negative z-score indicates a value below the mean. The absolute value gives the distance from the mean. Students sometimes focus only on magnitude and overlook direction, which can lead to misinterpretation.
- When solving z = (x − μ) / σ, some students may find it more intuitive to think in terms of distance from the mean. For example, they can calculate how many standard deviations correspond to a given z-score (e.g., 1.64 × σ) and then add or subtract that distance from μ. This approach can feel more concrete and reduce algebraic errors.
Student Supports
Lesson-specific resources to support all learners.
- Students often struggle to distinguish between boundary values and probability in a normal distribution. Reinforce that boundary values are marked on the horizontal axis and define the interval, while probability corresponds to the area under the curve between those values. Before students attempt to answer a problem, prompt them to first classify the problem statement as a “given value” problem or a “given area” problem. That is, they should classify which of the following categories describes the problem:
- Given value: Provides a value and asks them to find an area / probability
- Given area: Provides an area / probability and asks them to find a value
- Having students practice the above will also help them identify the proper calculator functions to use (e.g. normalCDF vs inverseNorm on TI calculators).
- Review the definition of percentile as the percentage of observations at or below a given value. Connecting percentiles to areas under the normal curve helps reinforce that probabilities represent accumulated area.
- Vocabulary used in the context of the lesson may include words that are unfamiliar or have several meanings. In particular, the following mathematical terms may need clarification or a definition provided:
- Normal curve
- Percentile
- Area
- Z-score
- In addition, the following contextual terms may need clarification or a definition provided:
- Home run
- At-bat
- Fastball
- Strike zone