Lesson 2.B.5 - Intro to Sampling Distributions

Key Question: Does the VA meet its wait time goals?
Content: Simulations | Sampling Distributions | Central Limit Theorem
Alignment: CED Topic 2.12
Teacher Guide
Course Resources
Resources for teaching our AP® Statistics curriculum.
- Lesson Flow - timing and flow of class, using our lesson materials
- Pacing Guide - pacing our units, with daily or block schedules
- CED Alignment Guide - aligning our lessons to the AP® Statistics Course and Exam Description
Teaching Resources
Resources for teaching with Skew The Script.
- Discussion Norms - our model discussion norms for the classroom
- Letter to Parents - letter to share with parents about our nonpartisan approach
- Teaching Math on Civic Topics - tips for teaching math lessons that cover civic topics
Lesson Notes
Lesson-specific insights from the creators of this lesson.
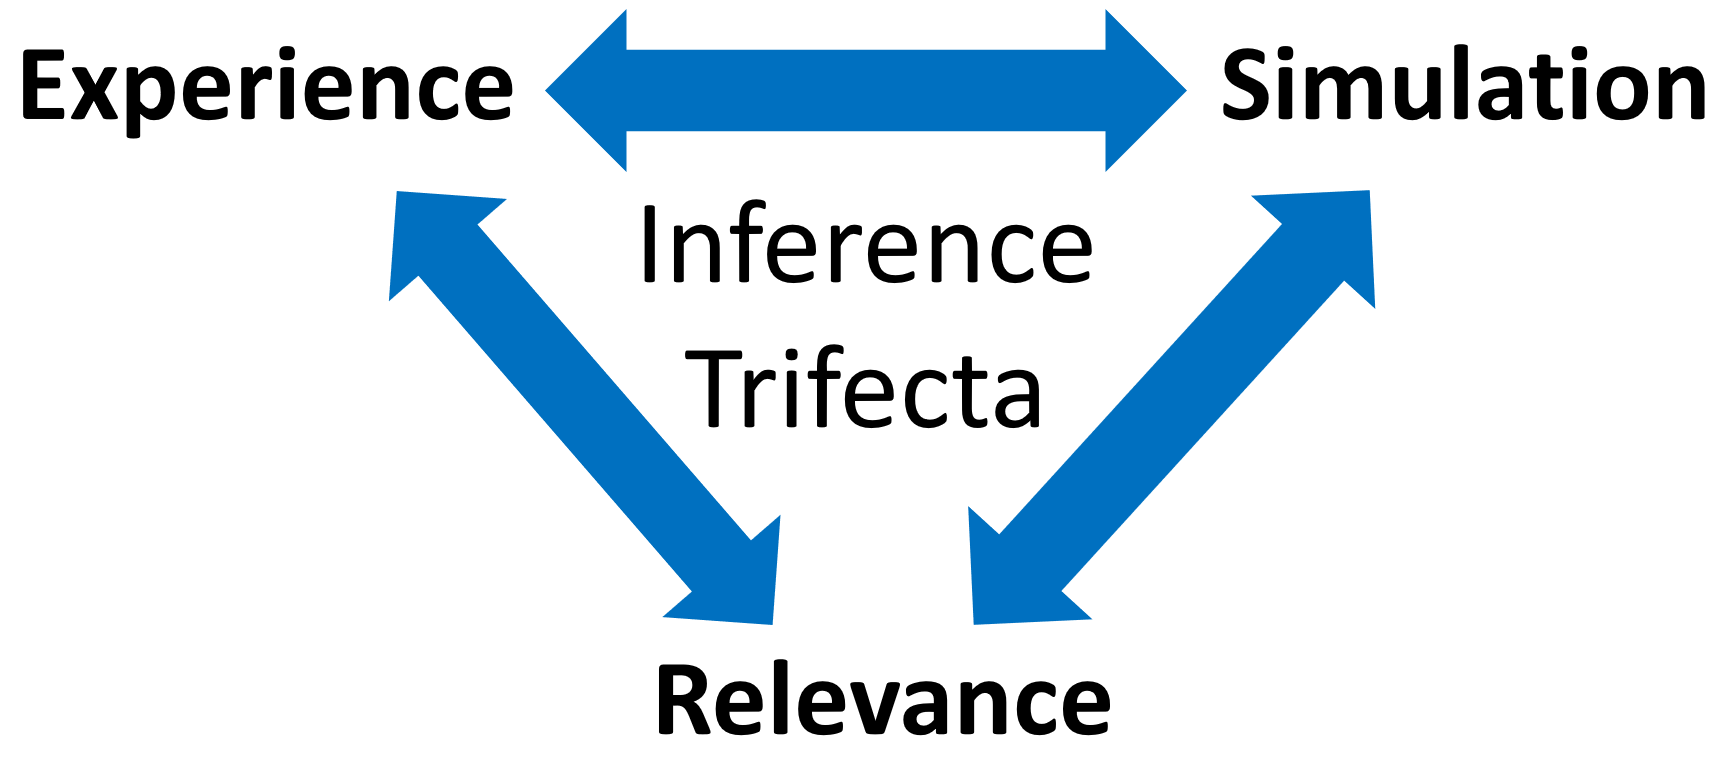
This lesson uses the inference trifecta approach, which differs from our typical lesson format. Before proceeding, watch the Teacher Guide Video above and familiarize yourself with the lesson materials (e.g. handout and key). Then, for additional background and teaching tips from the lesson creators, check out the sections below.
- Use simulation to make informal inferences about a claim
- Use simulation to describe a sampling distribution
- Use the central limit theorem to determine the likely shape of a sampling distribution
- For daily class schedules (45-min class periods), this lesson can be completed in two days:
- Day 1: Activity, Discussion Question
- Day 2: Practice, Mastery Check
- For block periods (90-minute class periods), the entire lesson can be completed on the same day.
- To start class, instructors play the video that introduces the lesson context. After the video plays, instructors can ask students: “What was the VA director’s claim about the average wait time for mental health appointments?” Note: He makes the claim at the 1:09 timestamp in the video.
- Then, students should work through the Simulated Sampling section of their handouts in groups, with the instructor providing light nudges and guidance as necessary. The instructions in the handout should provide most of the guidance students will need, including steps for utilizing the lesson applet to perform simulations.
- After completing the Simulated Sampling section, the instructor and students come back in full-group to discuss their results. Then, the instructors and students complete the Sampling Distributions and Central Limit Theorem sections as guided notes.
- After the guided notes, students discuss the Discussion Question in their tables groups. Then, students discuss in full-group, with the instructor facilitating. Finally, students proceed to the Practice problems and, eventually, the lesson Mastery Check.
First, download this lesson's Handout Key and read through its Discussion Question section. Then, check out our model discussion norms and the additional background notes below.
- It can be helpful to link the discussion back to the idea of sampling bias from earlier units. Nonrandom samples often create bias, leading to systematically overestimating or underestimating the mean.
- In future units, we will check the “random condition” for conducting inference procedures (hypothesis tests and confidence intervals). The random condition requires students to check that collected data come from either a random sample or an experiment with random assignment to treatments. The reason for this condition is exactly the point made in this discussion question: without a random sample, bias creeps into the process, leading to over or underestimating the truth. Referring back to this discussion question in future inference units can help motivate the need to always check the random condition.
- Students may not be familiar with the acronym “VA.” It’s worth taking time to explain that “VA” stands for the U.S. Department of Veterans Affairs – a federal agency that provides healthcare and other services to individuals who have served in the U.S. military.
- When sampling wait times from the VA, the instructions guide students to filter for returning appointments because the original “3 days” claim applies specifically to those visits, rather than new patient appointments.
- Although the sampling method in this lesson utilizes randomness, it’s still not perfect. Specifically, because the method provides random sample samples of locations, VA clinics that serve large rural areas may be overrepresented while t VA clinics that serve denser urban areas are underrepresented. Regardless, it’s important for any subset of VA clinics (urban or rural) to have short wait times. So, even if a more rural-tending set of samples shows long wait times, that’s still a problem for the VA and, of course, for veterans. In terms of student learning trajectories and making the best use of class time, it may not be worth bringing up this sampling issue, though it can be acknowledged if students raise questions about bias.
- The learning of this lesson lays the foundation for statistical inference. Sampling distributions will later be used to quantify how unusual a sample result is and to construct confidence intervals.
- Emphasize the difference in notation for the population mean (μ) and the sample mean (x̄). Proper use of this notation will be essential as students get into inference procedures later in the course.
- Students can use the applet to see the Central Limit Theorem in action by selecting different population shapes and sample sizes, then repeatedly clicking “add 100 samples” to build the distribution of sample means. As more samples are added, students can observe the sampling distribution becoming approximately normal. They can also see that larger sample sizes produce narrower sampling distributions, reinforcing the idea that larger samples lead to less variability.
- The idea that larger samples produce less variability connects directly to margin of error and standard error in later units. Building this intuition now can make those formal ideas more accessible later on.
- The formal proof of the Central Limit Theorem is quite technical and beyond the scope of AP Statistics. That said, for teachers or advanced students who are interested, this video walks through the structure of the proof.
Student Supports
Lesson-specific resources to support all learners.
- Sampling distributions can be challenging for students at first because the ideas are somewhat abstract. Emphasize the shift in focus from a distribution of individual data values to a distribution of statistics, which are computed from repeated samples. A couple helpful practices for this:
- As students use the applet to create simulations, ask them to explain in their own words how they know which distribution is the population, which is the sample, and which is the sampling distribution.
- When drawing a sampling distribution on the board, label each value in the distribution with a symbol for a statistic (e.g. x̄ or p̂) rather than a dot. This helps emphasize that each value is a statistics, rather than a data point.
- Vocabulary used in the context of the lesson may include words that are unfamiliar or have several meanings. In particular, the following mathematical terms may need clarification or a definition provided:
- Population
- Parameter
- Sample
- Statistic
- Sampling distribution
- In addition, the following contextual terms may need clarification or a definition provided:
- VA
- Veteran
- Wait time
- Students may not be familiar with the acronym “VA.” It’s worth taking time to explain that “VA” stands for the U.S. Department of Veterans Affairs – a federal agency that provides healthcare and other services to individuals who have served in the U.S. military.