
Lesson 3.4 - The Multiplication Rule
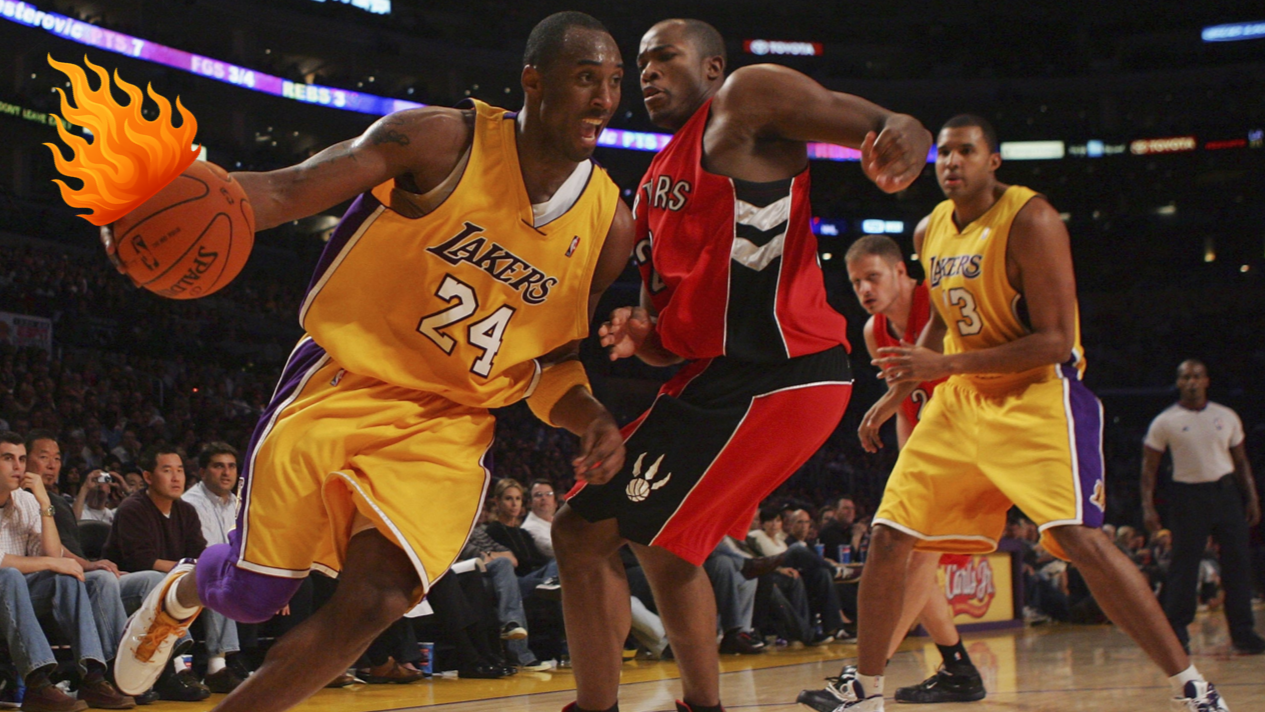
Key Question: Do players get hot hands?
Content: Tree Diagrams | Multiplication Rule | Repeated Events
Video
See the video on YouTube.
Course Resources
Resources for teaching our High School Statistics curriculum.
- Lesson Flow - timing and flow of class, using our lesson materials
- Pacing Guide - pacing our units, with daily or block schedules
- Alignment Guide - aligning our lessons to national and state standards for high school statistics
- Classroom Routines - a guidebook of classroom routines embedded within our lessons
Teaching Resources
Resources for teaching with Skew The Script.
- Discussion Norms - our model discussion norms for the classroom
- Letter to Parents - letter to share with parents about our nonpartisan approach
- Teaching Math on Civic Topics - tips for teaching math lessons that cover civic topics
Lesson Notes
Lesson-specific insights from the creators of this lesson.
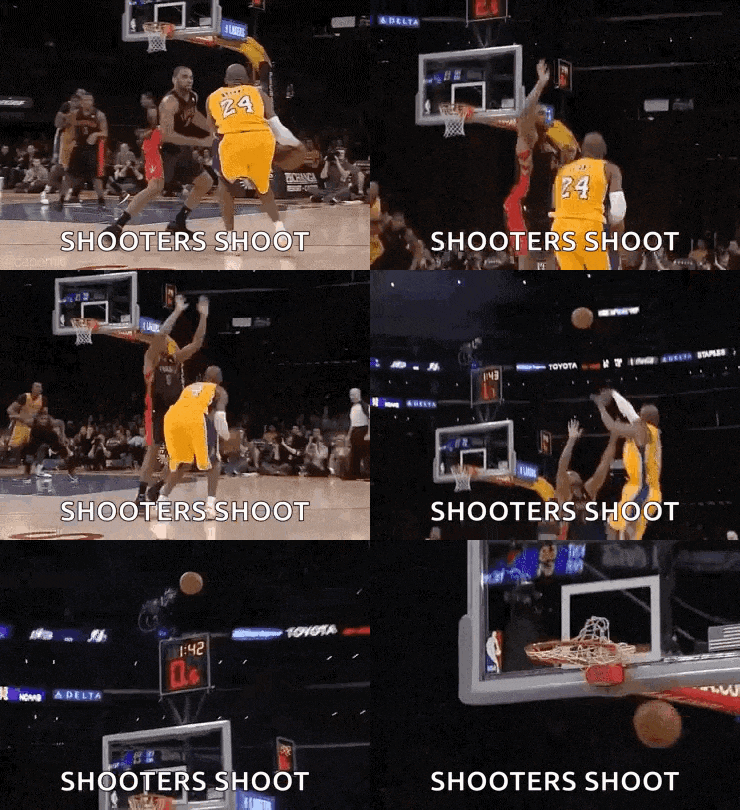
In basketball, if a player is making a lot of their shots, they’re said to have the “hot hand.” Their skill level seems to be higher that day. However, some statisticians claim that the hot hand isn’t real. Rather, they argue that if you take a lot of shots, you’re bound to get some good streaks by chance alone. Well, if anyone had a hot hand, it was Kobe Bryant on the day he scored a remarkable 81 points in a single NBA basketball game. In this lesson, students break down Kobe’s remarkable performance using the multiplication rule and the principles of probability. Then, they answer the question: Did Kobe have a hot hand?
- Represent probabilistic events with tree diagrams
- Use the multiplication rule to calculate joint probabilities
- Find the probabilities of repeated, sequential, and “at least one” events
Just as the prior lesson paired conditional probability with Venn diagrams, this lesson introduces the multiplication rule alongside tree diagrams. In doing so, we continue to reinforce using the Keys to Probability – particularly “Draw it First” – over strict adherence to formulas. Tree diagrams offer a useful visual model for organizing information about conditional events, sequential events, and repeated events. Though, after enough practice, students may get comfortable enough with performing the calculations for repeated events to no longer need the tree diagram. In the next lesson, students will build on their understanding of the multiplication rule and repeated events from this lesson, in order to motivate the concept of independence.
Before proceeding: Familiarize yourself with the lesson materials linked above (e.g. handout, handout key, slides, video). Then, for additional background and teaching tips from the lesson creators, check out the sections below.
- A great way to start this lesson is by asking students who do repeated skill-based activities – like sports (e.g. basketball or baseball), games (e.g. chess or video games), or performance arts (e.g. dance or band) – whether they’ve experienced the “hot hand.” First, ask them what it felt like to be especially “on” during a certain day. Then, challenge them: Is there a chance that, instead of truly being “better” that day, they just got a bit luckier than usual that day? If they were just luckier, would it feel or look any different than truly having a hot hand? This can inspire some heated debates that will help motivate the lesson.
- As we continue introducing students to different visual representations for probability problems, it’s helpful to provide guidance on choosing the best visual for different scenarios. Generally, tree diagrams are most useful for situations involving sequential events or events with dependencies (e.g. if A occurs, then the probability of B becomes…). Otherwise, Venn diagrams (prior lesson) and two-way tables (next lesson) tend to be more useful.
- For P(at least one) problems, students may wonder why we use the 1 – P(none) approach, rather than trying to directly calculate P(at least one). The reason can be demonstrated to students by trying to directly calculate the answer to this problem from the lesson: “What is the probability that Stephen Curry makes at least one of his next 4 free throws?” To directly calculate this probability, we’d first have to find the probability he makes exactly 1 free throw (0.906 × 0.094 × 0.094 × 0.094). However, the made free throw could have come on his first shot, second shot, third shot, or fourth shot. So, the total probability for all these scenarios is 4(0.906 × 0.094 × 0.094 × 0.094). Then, we’d have to add the probability he makes two free throws, multiplied by the number of ways to order two makes and two misses. And so on. As students will quickly see, the 1 – P(none) approach is much more efficient.
First, download this lesson's slide deck and handout key to see the prompt and sample responses for the Lesson Starter. Then, check out the additional background notes below.
Instructional routine: Would You Rather. The "Would You Rather” routine provides an opportunity for students to develop their higher-order thinking skills, active listening skills, and ability to communicate arguments, all from a simple binary prompt. Students resistant to choosing just one of the two options can be encouraged to select the option that they can best justify. Generally, there is not one correct answer to the prompt in this routine, allowing the focus to be on justification of the choice made, rather than the choice itself. You can find more background on implementing a Would You Rather here.
Purpose & Background: Students consider a coin that has recently come up with “heads” on five consecutive flips. They choose whether to keep the coin or change to a new one. Consistent with the Would You Rather? routine, either response is fine, provided that students have justification for their choice. While technically a modification of the routine, some students may also come up with a third choice: it doesn’t matter which coin is chosen. Ultimately, the discussion will provide a useful framing for the lesson’s main topic: does making many basketball shots in a row indicate luck (a fair coin on a streak) or a truly “hot hand” (a weighted coin with a truly higher probability of “heads” that day).
First, download this lesson's handout key and read through its Discussion Question section. Then, check out our model discussion norms and the additional background notes below.
- For more background on why Kobe taking 30,697 shots in his career means that he’d have 30,690 chances at an 8-shot streak, check out this optional video.
- It can be helpful to name that 44.7% was not the true probability for Kobe making every one of his shots. Some of his shots had a higher probability of going in (e.g. easy dunks close to the hoop), and some of his shots had a lower probability of going in (e.g. fade-way three pointers as the shot clock wound down). However, 44.7% was the average probability over the course of his whole career, aggregating across all the shots he took. And it turns out that Kobe’s number of 8-shots streaks (47) is very close to what would be predicted by chance (48.8), using that average probability. This is a striking example of the fact that, as long as enough trials are performed (e.g. taking over 30,000 shots), unusual streaks (e.g. making 8 shots in a row) may occasionally emerge by chance.
- A hot hand theory supporter could also make calculations that produce good predictions for the number of 8-shots streaks in Kobe’s career. In particular, if we assume Kobe had as many “cold hand days” as he had “hot hand days,” these should balance out – to the point that we get similar predictions to those made by assuming every shot had a 44.7% chance of going in.
- Mathematical analysis of the hot hand was first largely popularized by a 1985 article by Thomas Gilovich, Robert Vallone, and Amos Tversky titled, “The hot hand in basketball: On the misperception of random sequences.” For much of the time following this article, the “hot hand” was treated as a myth that, statistically, didn’t hold water.
- However, mathematical arguments for the validity of the hot hand have had a resurgence in recent years. For example, this paper (2018) by Joshua Miller and Adam Sanjurjo proposes a bias that exists in earlier research of the hot hand that, when accounted for, could reverse earlier results. Here’s a nice summary of what they wrote.
- Ultimately, even in the deepest recesses of the academic literature, the hot hand is still hotly debated (pun intended).
- Another way to frame the hot hand argument is as an argument for independence or dependance. If there is no hot hand, we’re assuming that all shots are independent – prior outcomes have no effect on the next shot’s probability of going in. In a world with a hot hand, shots are dependent. Making several shots in a row raises the probability of making the next shot, and missing several shots in a row lowers the probability of making the next shot. We introduce the idea of independence and dependence more formally in the next lesson.
- The multiplication rule and the conditional probability formula are two sides of the same coin (no probability pun intended!). The conditional probability formula (introduced last lesson) can be written as the following: \( P(B|A) = \frac{P(A \cap B)}{P(A)} \). If we multiply both sides by P(A), we end up with the equation: P(B|A) ⋅ P(A) = P(A∩B). With some reordering of terms, this becomes the multiplication rule: P(A∩B) = P(A) ⋅ P(B|A).
Student Supports
Lesson-specific resources to support all learners.
- Among all the Keys to Probability, the one that best supports students in getting started with probability problems is “Draw it First.” For the practice exercises that don’t already include a tree diagram, encouraging students to draw one can help them organize the information and organize their thinking.
- For supporting students with finding conditional probabilities, encourage them to cover up any parts of the tree diagram that they no longer have to consider. For example, consider this exercise from the practice: If a student said they always use AI to help with their homework, what is the probability that the student was asked the question by a professor? Since we know the student reported always using AI for homework help, they can scribble out any branches of the tree diagram that show any other response. Those branches are no longer relevant.
- Mathematical Language Routines useful for this lesson: Collect and Display (MLR2)
- Students can create (or continue) their own probability graphic organizer, including the “Keys to Probability,” tree diagrams, the multiplication rule, and the approach for “at least one” events.
- The lesson context – basketball – was previously introduced in the course (initially in Lesson 1.7) and will appear again. So, it may be helpful to add basketball terms from this lesson to any ongoing language collections in class.
- Vocabulary used in the context of the lesson may include words that are unfamiliar or have several meanings. In particular, the following mathematical terms may need clarification or a definition provided:
- Tree diagram
- Exponent
- Complement
- In addition, the following contextual terms may need clarification or a definition provided:
- Admitted
- Up to par
- Free throw
- Streak