
Course Resources
Resources for teaching our High School Statistics curriculum.
- Lesson Flow - timing and flow of class, using our lesson materials
- Pacing Guide - pacing our units, with daily or block schedules
- Alignment Guide - aligning our lessons to national and state standards for high school statistics
- Classroom Routines - a guidebook of classroom routines embedded within our lessons
Teaching Resources
Resources for teaching with Skew The Script.
- Discussion Norms - our model discussion norms for the classroom
- Letter to Parents - letter to share with parents about our nonpartisan approach
- Teaching Math on Civic Topics - tips for teaching math lessons that cover civic topics
Lesson Notes
Lesson-specific insights from the creators of this lesson.

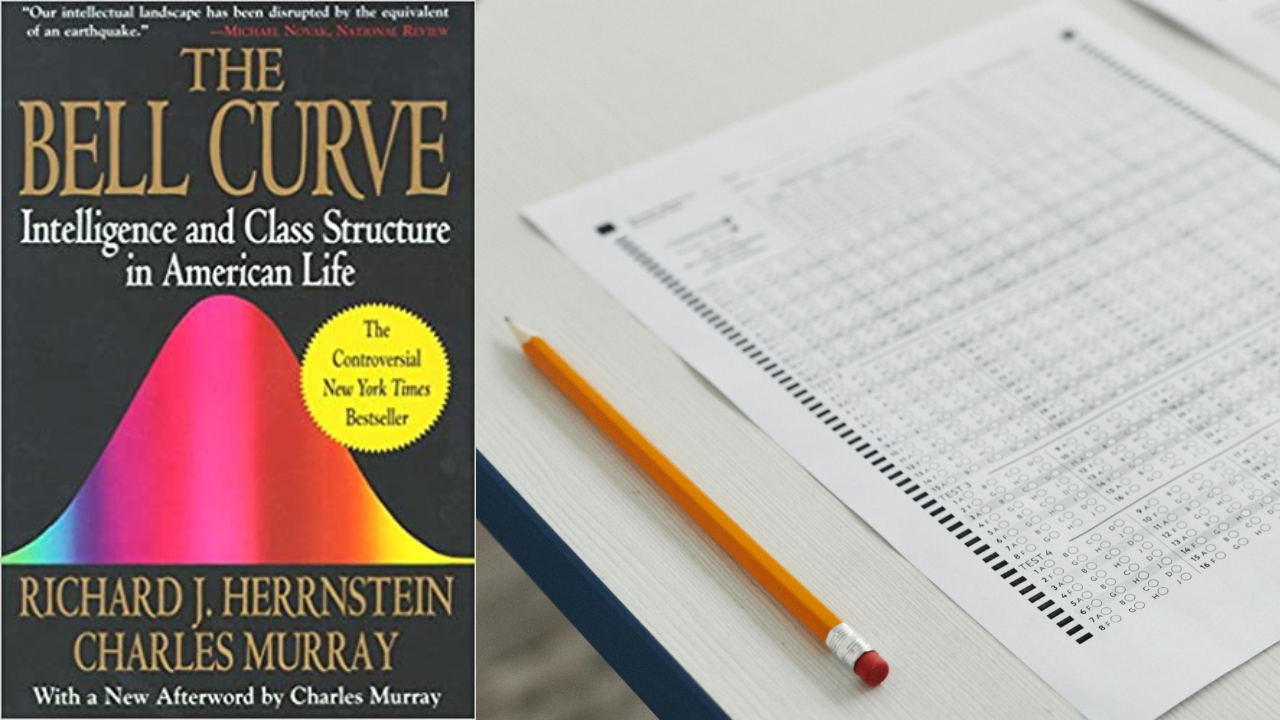
This lesson tackles a controversial claim from the best-selling book The Bell Curve. In the book, the authors claim to find evidence of racial differences in IQ. In this lesson, students model IQ using the normal distribution, or the “bell curve.” Then, they investigate the tests that the authors used to measure IQ. Students discover that these tests may not be measuring true “intelligence” after all. Ultimately, students experience one of the most important lessons in the study of statistics: that the quality of a claim depends on the quality of the data behind it.
- Describe the key properties of the normal distribution
- Use the empirical rule to find normal curve probabilities and values
Students continue developing their statistical vocabulary as they learn about random variables, normal curves, and the empirical rule. Drawing from their prior knowledge of mean, standard deviation and shape (symmetry), students develop a sense of the normal curve, as well as its shape and properties. Then, they use the empirical rule to estimate normal curve values and probabilities. In the next lesson, students will build on this understanding of normal curves to perform more precise calculations. Understanding normal distributions and the associated calculations will support students’ learning in the upcoming inference units, in which normal curves are used to calculate confidence intervals and p-values.
Before proceeding: Familiarize yourself with the lesson materials linked above (e.g. handout, handout key, slides, video). Then, for additional background and teaching tips from the lesson creators, check out the sections below.
- Deciding on the best way to pose this lesson’s Key Question can be challenging. As a model, here’s the framing that the presenter uses in the lesson’s instructional video. Feel free to use it and modify: “[The authors] arrived at a controversial result: that there appeared to be racial differences in IQ levels. Now, let me say out front that I personally believe this is a flawed and, frankly, racist claim. As someone who has taught students of varying ethnic and racial backgrounds, I’ve never seen differences in intellectual potential across those backgrounds. That said, this claim from The Bell Curve didn’t prevent the book from becoming a best seller. And these ideas are still discussed privately and even publicly on forums like podcasts, where Charles Murray – one of the authors – has been invited to continue discussing The Bell Curve. When we hear claims like this, one reaction is to reject them because we don’t agree with their conclusions. But another is to investigate them statistically. To openly hear and analyze the evidence and, if there are flaws, point out how those flaws arise. If you can expose the flaws in an incorrect claim, then you have a shot at convincing people that it’s false. Otherwise, flawed ideas will live on. So, we’re going to openly investigate The Bell Curve's claim today by answering this Key Question: Does IQ truly vary by race?”
- Encourage students to “draw first” (draw the curve) when encountering a normal curve problem. This will help them organize their work and thinking. A sketch of the curve doesn’t have to be perfect, but should include the horizontal axis, tick marks to show scale, symmetry about the mean, and shading to represent areas of interest.
- Instructors can highlight that the empirical rule (68 - 95 - 99.7 rule) provides only estimated probabilities, in order to provide an intuitive understanding of how data are distributed around the mean. These values are approximations. In the next lesson, students will use z-scores and technology to compute more precise probabilities.
First, download this lesson's slide deck and handout key to see the prompt and sample responses for the Lesson Starter. Then, check out the additional background notes below.
Instructional routine: Would You Rather. The "Would You Rather” routine provides an opportunity for students to develop their higher-order thinking skills, active listening skills, and ability to communicate arguments, all from a simple binary prompt. Students resistant to choosing just one of the two options can be encouraged to select the option that they can best justify. Generally, there is not one correct answer to the prompt in this routine, allowing the focus to be on justification of the choice made, rather than the choice itself. You can find more background on implementing a Would You Rather here.
Purpose & Background: The goal of this Lesson Starter is for students to consider a circumstance (competitive diving) where they likely lack the knowledge or prior background to make an informed decision. The intent, in fact, is to frustrate them, creating a space where they are ready to consider the context presented at the beginning of the lesson slide deck and video: IQ tests given to Ellis Island immigrants who had limited background in the test’s language (English) and subject matter. Generally, this exercise prepares students to consider a question that is asked throughout the lesson: is it possible for any test to separate “innate intelligence” from prior background, experience, and education? Note: While many students may feel frustration during this Lesson Starter, students with background knowledge in competitive diving may feel fully comfortable providing their input. This also provides a helpful simulation for the class of the advantage experienced by those with prior background and knowledge in the subject matter.The actual choices for the Lesson Starter question are unimportant for this introduction to the lesson, but for students who have background knowledge of diving, sample responses are provided in the handout key.
First, download this lesson's handout key and read through its Discussion Question section. Then, check out our model discussion norms and the additional background notes below.
- Encourage students to consider confounding factors that might explain differences in test results across groups. This can open discussion around differences in educational access, especially at the time that the AFQT data was collected (1980). This will help keep the conversation focused on the quality of the data and the measurement instrument, rather than assumptions about ability.
- Although it’s certainly not the focus of the Discussion Question, some students may try to answer the example AFQT questions. To answer the math question, students must assume that the trapezoid is neither a right nor an isosceles trapezoid (as the diagram suggests). With these assumptions in place, option C is the correct answer. Without these assumptions, other answer choices are possible. Modern assessments (e.g. today’s SAT, ACT, and state standardized tests) expect students not to make such assumptions about diagrams. Therefore, this question would not live up to the standards of today’s standardized tests and would not be included.
- Although The Bell Curve was published more than 30 years ago, the co-author Charles Murray remains a prominent speaker and author. He continues to be invited on podcasts to discuss ideas from The Bell Curve. One example is the Sam Harris podcast episode “Forbidden Knowledge.” In the prelude to the interview, the host states: “People don’t want to hear that intelligence is a real thing; and that some people have more of it than others; they don’t want to hear that IQ tests really measure it…for better or worse, these are all facts.” As this lesson’s Discussion Question demonstrates, the idea that tests (like the AFQT) “really measure” intelligence is far from an established fact. In reality, there is little psychological consensus on how to define intelligence – let alone measure it. So, the analyses of IQ tests tackled in this lesson are still relevant for preparing students to engage with – and uncover flaws within – ongoing conversations in the public sphere.
- IQ scores are often modeled using a normal distribution. However, this is an approximation, rather than a perfect representation of IQ score data. The normal curve is a theoretical model of the population, represented as a smooth density curve, while real data may show irregularities and skewness. In fact, the authors of The Bell Curve had to apply transformations to the raw AFQT data (which had substantial skew) to model it using a normal curve.
- A common source of confusion is whether to use strict (<, >) or inclusive (≤, ≥) inequalities when notating normal curve boundaries. For continuous distributions, the probability of P(X=x) is zero. That is, the probability of a continuous random variable taking on a single exact value is zero, since there are infinitely many possible values within a continuous interval. As a result, probabilities for a normal distribution must be calculated over an interval, but whether the interval is open or closed does not affect the probability. So, either notation (strict or inclusive) is acceptable.
- Normal curves are mathematical functions, which have a complex functional form that is outside the scope of this course. However, at a broader level, instructors can describe normal curves as a family of functions. Just as y = x2 serves as a parent function for parabolas, the standard normal distribution (a normal curve with a mean of 0 and standard deviation of 1) serves as a “parent” for the family of normal curves. As such, changes to μ determine the horizontal shift of the curve, while changes to σ determine the horizontal stretch.
- Larger values of σ produce wider, flatter curves, while smaller values produce narrower, taller curves. Generally, whether a standard deviation is “large” or “small” depends on the scale of the data. The same value of σ may represent a wide spread in one distribution and a narrow spread in another, depending on the magnitude of the mean.
Student Supports
Lesson-specific resources to support all learners.
- Students often struggle to distinguish between boundary values and probability in a normal distribution. Reinforce that boundary values are marked on the horizontal axis and define the interval, while probability corresponds to the area under the curve between those values. Before students attempt to answer a problem, prompt them to first classify the problem statement as a “given value” problem or a “given area” problem. That is, they should classify which of the following categories describes the problem:
- Given value: Provides a value and asks them to find an area / probability
- Given area: Provides an area / probability and asks them to find a value
- Having students practice the above will also help them identify the proper calculator functions to use in the next lesson.
- Vocabulary used in the context of the lesson may include words that are unfamiliar or have several meanings. In particular, the following mathematical terms may need clarification or a definition provided:
- Normal curve
- Bell curve
- Empirical rule
- In addition, the following contextual terms may need clarification or a definition provided:
- IQ
- Psychometric
- Students sometimes believe “at least” means “less than,” when it really means “greater than or equal to.” To support, consider providing framing like this: “The phrase ‘at least 4’ means that the least value is 4. So, we’re looking for 4 or higher.” Similarly, for the phrase “at most,” this framing can help: “The phrase ‘at most 8’ means that the most value is 8. So, we’re looking for 8 or lower.”