Lesson Updates (Semester 1)
To be relevant, you need to stay relevant. That's why, every summer, we update some of our lessons with more recent data, more engaging contexts, and other improvements based on teacher feedback. Below is a summary of changes we've made to AP Stats materials normally taught in Semester 1.
We think you'll really like these changes. That said, don't worry: In most cases, if a lesson has received a major update, you'll find a link at the bottom of the page to an "archived" version that you can continue to use. Go with your preference!
Minor Changes (All Lessons)
Across all lessons (based on teacher feedback):
We're making the guided notes a bit less structured. Less fill-in-the-blank and more open-ended. This will put more of the onus for note-taking and thinking on the students.
We're reducing the amount of info in the footer of the handouts, so students have more room to write.
We've completed the above changes for Parts 1-2 of the curriculum and will finish through Part 4 by the end of the summer.
Major Changes (Lesson-Specific)
Note: You can find "archived" versions of these lessons linked at the bottom of their webpages. Most major changes were clustered in Parts 1-2 of the curriculum.
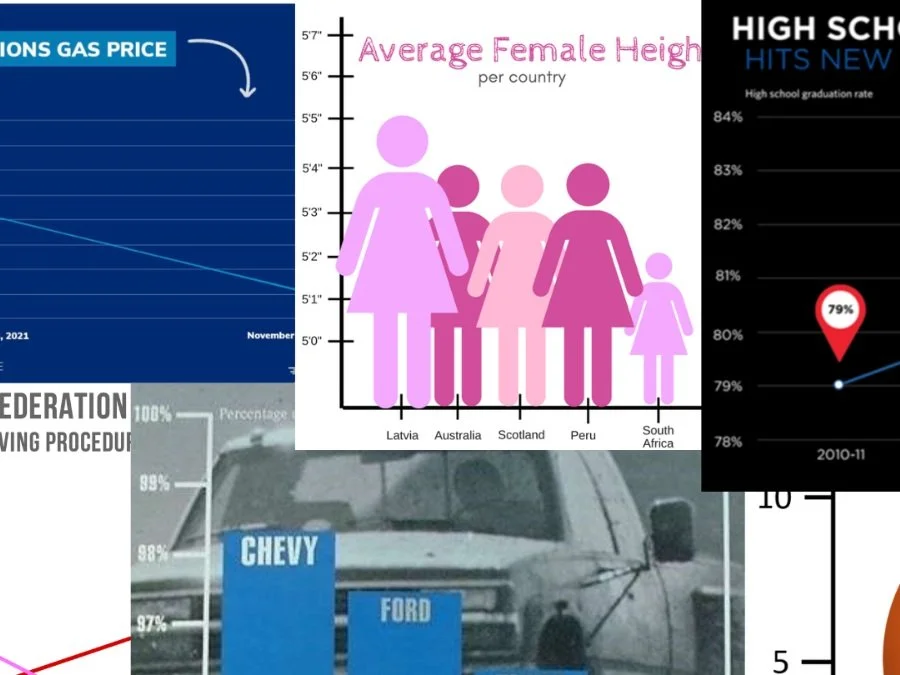
Misleading with Data
Lesson 1.1
Added more recent misleading graphs (e.g. about Biden administration)
Added more compelling examples of truncated y-axes

Describing Categorical Data
Lesson 1.2
Updated NYPD data 2011 -> 2020
Changed focus from use-of-force to who gets stopped. This sets up a better discussion question that doesn't require knowledge from later units (e.g. association vs. causation).

Describing Categorical Data
Lesson 1.3
Lesson updated to include a more engaging context: Why would anyone make (or watch) a movie about the Oakland Athletics?
Formatting of plots improved
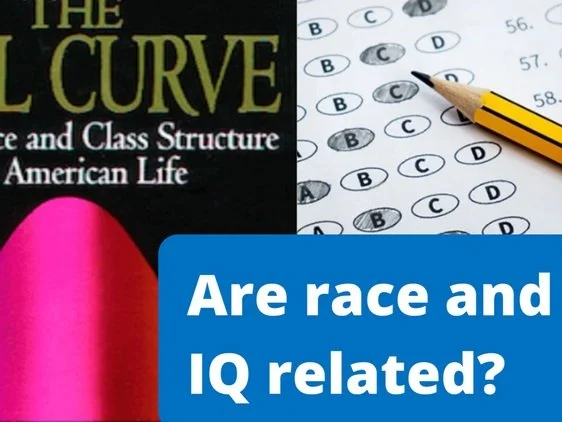
The Empirical Rule
Lesson 2.3
Additional context is given about the history of IQ tests and how they've been used (and misused) in the past.

More on Normal Curves
Lesson 2.4
Rather than IQ tests again, this lesson now has a new context: Can statistics reveal an unknown hero behind the Marlins Miracle?
To better prep students for inference, lesson focuses on z-scores (rather than calculator input)