Part 1: Exploring Data
Covers: Topics 1.1 - 1.9 and 2.1 - 2.3 of the Course & Exam Description (CED)
Stats Content (CED Topics 1.1-1.2)
Categorical vs. Quantitative Data
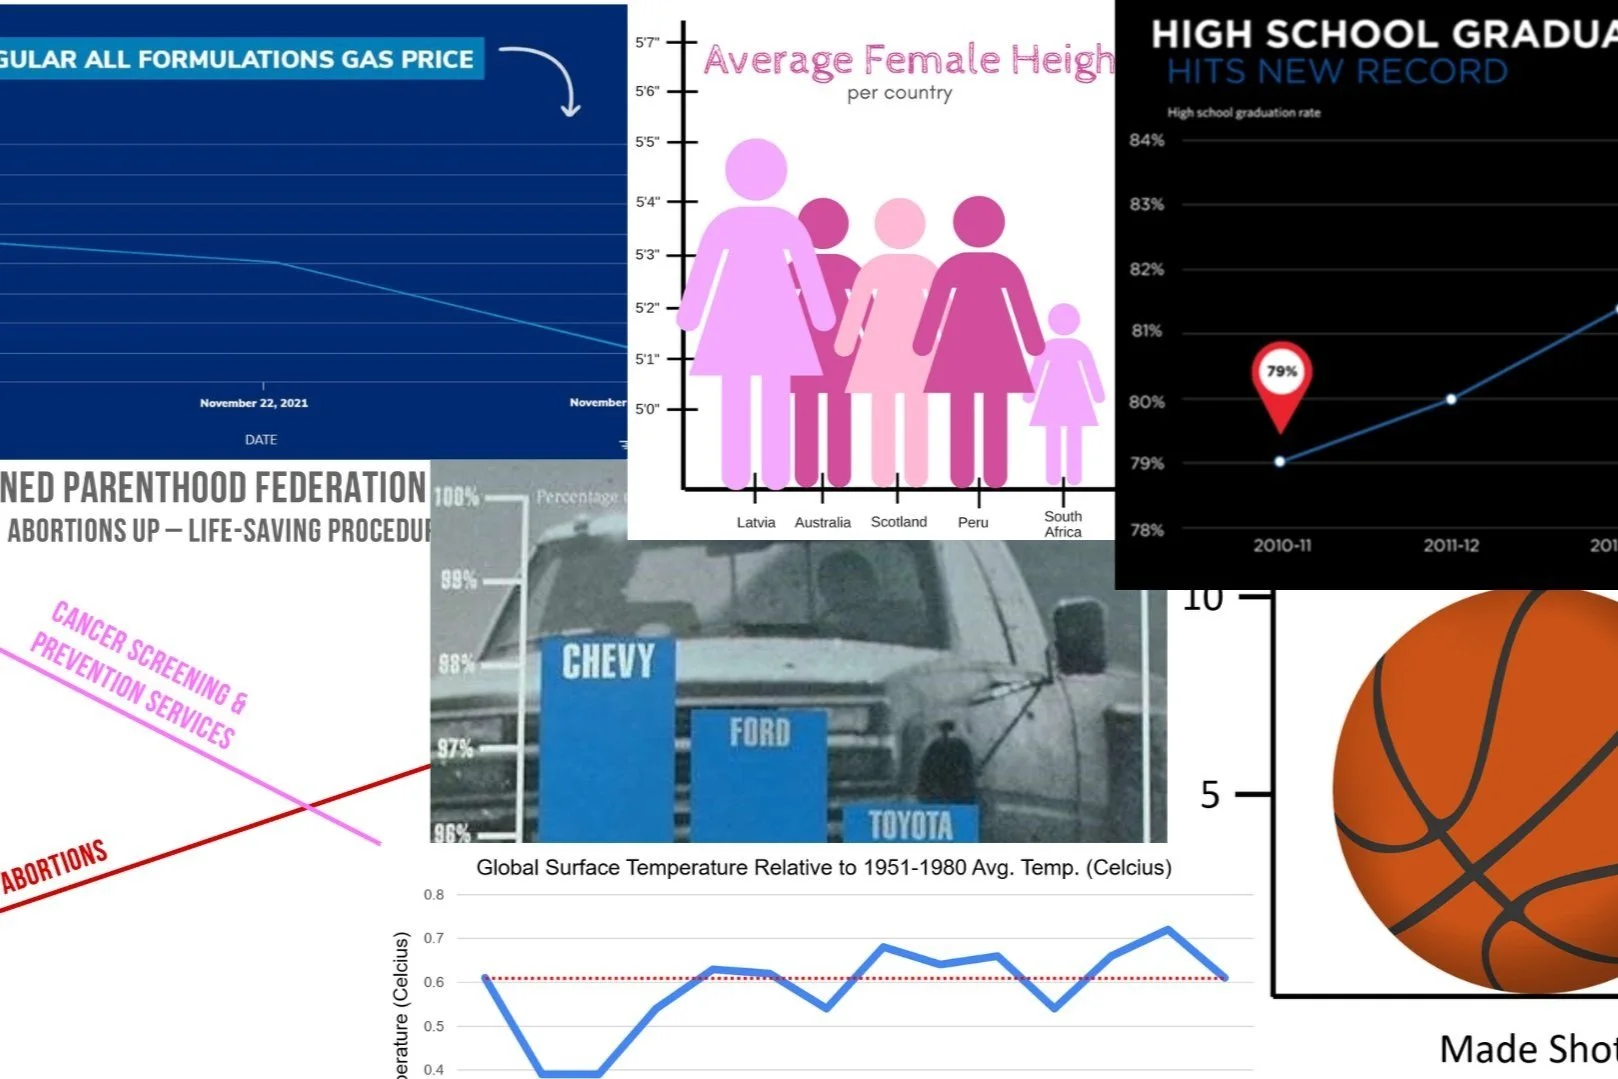
Misleading Data Visuals
Relevant Context
Misleading graphs in politics, sports, business, and science
Stats Content (CED Topics 1.3-1.4, 2.1-2.3)
Marginal & Conditional Distributions
Side-by-Side & Segmented Bar Graphs
Describing Associations
Relevant Context
Version A: Policing
Version B: Admissions
Version C: Basketball
Stats Content (CED Topics 1.5-1.6)
Frequency and Relative Frequency
Dotplots, Stemplots, Histograms
CSOCS
Relevant Context
Baseball and “Moneyball”
Stats Content (CED Topic 1.7)
Mean, Median
Range, Standard Deviation, IQR
Summary Stats on Calculator
Relevant Context
Salary Misrepresentation
Stats Content (CED Topics 1.8-1.9)
Determining Outliers
5 Number Summary, Boxplots
Comparing Distributions
Relevant Context
The Politics of “Average”
Taxes & the Middle Class
Quizzes for Part 1 (Exploring Data)
Quiz Format (Versions A & B)
Multiple Choice: 10 items. Recommended time: 23 minutes.
Free Response: 2 items. Recommended time: 26 minutes.
Quiz Links: Access the quizzes here.


