
Course Resources
Resources for teaching our AP® Statistics curriculum.
- Lesson Flow - timing and flow of class, using our lesson materials
- Pacing Guide - pacing our units, with daily or block schedules
- CED Alignment Guide - aligning our lessons to the AP® Statistics Course and Exam Description
Teaching Resources
Resources for teaching with Skew The Script.
- Discussion Norms - our model discussion norms for the classroom
- Letter to Parents - letter to share with parents about our nonpartisan approach
- Teaching Math on Civic Topics - tips for teaching math lessons that cover civic topics
Lesson Notes
Lesson-specific insights from the creators of this lesson.
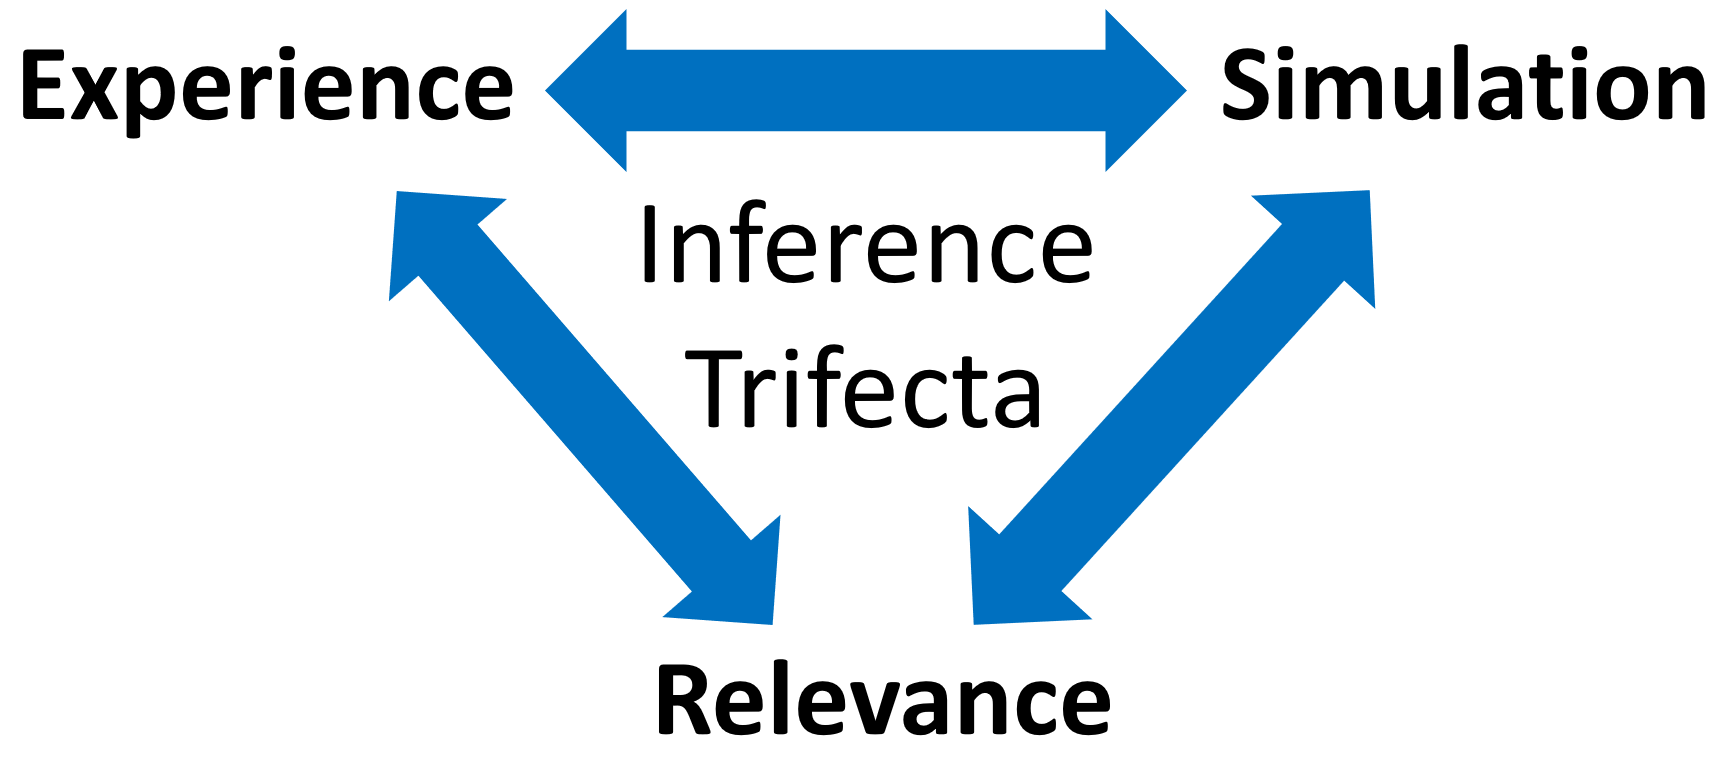
This is an optional enrichment lesson. Instead of covering new topics from the course, this lesson showcases an important application of sampling distributions and builds intuition for later course material (e.g. statistical inference). Note that this lesson uses the inference trifecta approach, which differs from our typical lesson format. Before proceeding, watch the Teacher Guide Video above and familiarize yourself with the lesson materials (e.g. handout and key). Then, for additional background and suggestions from the lesson creators, check out the sections below.
- Use simulation to make inferences and evaluate fairness
- Use simulation to describe a sampling distribution
This lesson can be completed in one 45-minute class period.
- Introduction (5 min): To start class, play the video that introduces the lesson context. Then ask students: “What do you think: Can math solve gerrymandering?” Allow students to share their first thoughts with table partners, followed by discussing as a whole group.
- How Gerrymandering Works (15 min): Students use this simulation to practice gerrymandering on their own devices. Students should stop after the 6th challenge in the simulation. Then, students complete the questions about Idaho before discussing their findings as a class. As an extension, instructors can project the map of Idaho on the board and have student volunteers come up to draw potential districts. This leads to students contributing all sorts of shapes and can enrich discussion.
- The Statistician’s Answer: Simulation & Sampling Distributions (15 min): Students use the redistricting simulation applet on their own devices or in groups to answer the questions. Running the simulation for Oregon on the board first can provide a helpful whole-class demonstration of how the applet works. Students can then run their own simulations and answer the remaining questions.
- Discussion Question (10 min): Students first respond independently on their handouts. Then, they discuss with a table partner, before participating in a whole-class discussion. See the lesson handout key and the “Extra Background: Discussion Question” section below for further notes.
First, download this lesson's Handout Key and read through its Discussion Question section. Then, check out our model discussion norms and the additional background notes below.
- This question is building towards a hypothesis test. If the proportion of districts more extreme than the drawn map (the “p-value”) is lower than 5% (the “alpha level”), we reject the map (reject the null hypothesis that the map was fair). Of course, the analogy to hypothesis tests isn’t perfect, but it’s all about building intuition.
- We typically use 5% as the alpha level in hypothesis tests, but it’s totally fine for student’s answers here to vary - as long as they have a relatively low number and use the logic of finding a threshold that indicates a map is “surprising” or “unusual” compared to most simulations.
- Some students may treat any disproportionate result as evidence of bias. Reinforce that randomness alone can produce varying outcomes, especially in smaller samples. The key question is not whether the result appears disproportionate, but whether the real map is highly unusual compared to what would be expected under random districting. This helps shift attention from the outcome itself to where it falls within the distribution of simulated results.
- In Idaho, drawing a majority-Democrat district is not just unlikely, it is mathematically impossible. Given the requirement to make all districts have approximately equal population sizes, there is no way to draw a majority Democrat district. To test this, try running many simulations for Idaho in the redistricting simulation applet. Every time the simulation runs, both of Idaho’s districts will be majority Republican. This example offers a useful distinction between outcomes that are rare and those that cannot occur at all.
- In the 2019 case Rucho v. Common Cause, the Supreme Court ruled that partisan gerrymandering is a “political question” beyond the jurisdiction of federal courts. Writing for the majority, Chief Justice Roberts argued that, although extreme partisan maps may be unjust, there is no “judicially manageable standard” for determining when a map becomes too biased. In response, a group of mathematicians submitted an amicus brief proposing a statistical approach. Their argument was that one can generate many possible district maps under neutral conditions and compare the existing district map to this distribution. If the existing map is an extreme outlier relative to those simulations, it provides evidence of bias. This mirrors the core idea of the lesson, where simulation is used to build a sampling distribution and evaluate whether a result is unusually extreme.
- While redistricting has traditionally taken place every ten years alongside the census, recent efforts to redraw maps mid-decade provide a current and relevant context to discuss gerrymandering. These efforts have occurred across political parties, with the goal of gaining electoral advantage. Introducing this context can help students see why the question of “fairness” matters, and why a statistical approach is useful for distinguishing between predictable random variation and bias.
- In this lesson, students will propose their own ideas about what counts as a “surprising” or “unlikely” result. Their answers will vary. Rather than settling on a single definition too quickly, it can be useful to surface those differences and then connect them to the Empirical Rule as a way of identifying outcomes that fall in the tails of a distribution, which provides an initial justification for what might be considered unlikely.
- In statistics, 5% is a commonly used cutoff for determining whether a result is unlikely, but this is not fixed and depends on context. When the stakes are higher, stronger evidence may be required. For example, when evaluating a new medical treatment with potential risks, a smaller cutoff may be used to reduce the chance of drawing an incorrect conclusion.
- This lesson sets the stage for the logic of hypothesis testing. Students are beginning to ask whether a result is unlikely under a random process, which will later be formalized using the p-value. They are also implicitly considering how unlikely is “unlikely enough,” which connects to the role of alpha as a decision threshold.
Student Supports
Lesson-specific resources to support all learners.
- When working with simulation results, students may concentrate on individual outcomes rather than the overall pattern. Encourage them to avoid focusing on any single result and instead look at where most outcomes fall and how much variability there is. This builds intuition for sampling distributions, which will be formalized later.
- Encourage students to start their explanations with “If districting were random…” or “in a world where districts were drawn randomly…” This helps keep their reasoning tied to the simulation rather than drifting into opinion.
- Vocabulary used in the context of the lesson may include words that are unfamiliar or have several meanings. In particular, the following mathematical terms may need clarification or a definition provided:
- Proportional
- Simulation
- In addition, the following contextual terms may need clarification or a definition provided:
- Gerrymandering
- Redistricting
- House of Representatives